Hello everyone,
I have a question regarding the visualization of a bar plot that I did with matplotlib.
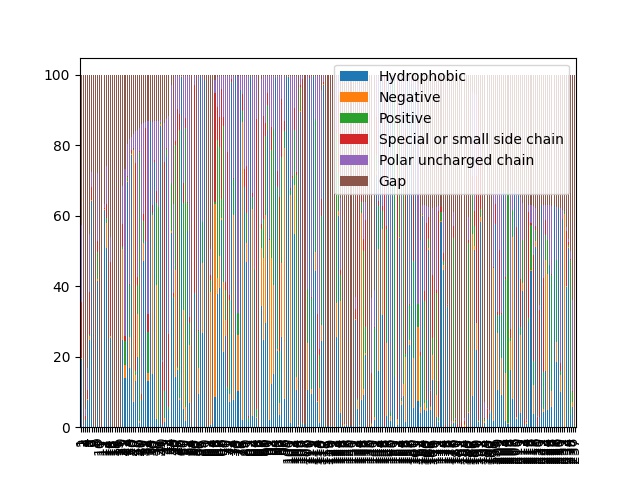
The code that I used to do this figure was:
transpose_df.plot.bar(stacked=True)
The transpose_df is a dataframe that I created using an empty numpy matrix and then iterate in a database to fill it.
How can I do to fit the figure so there is no overlaping of the values of the x-axis and also the bar are clear.
Thank you.