I’m using the mscatter fix documented at `plot` and `scatter` should allow `marker` to be a list · Issue #11155 · matplotlib/matplotlib · GitHub to plot points with different markers but when I try to set edgecolours for some points, non-filled markers like x disappear.
Would anyone be able to shed some light on how to correctly set edgecolour of a marker to match the facecolour when editing a scatter plot using set_paths()? The docs at matplotlib.pyplot.scatter suggest using 'face' but it seems like it cannot be passed through as part of an array of edgecolours.
Here is a demo problem:
import numpy as np
import pandas as pd
import matplotlib.pyplot as plt
def mscatter(x, y, ax=None, m=None, **kw):
"""Set custom markers for each datapoint.
https://github.com/matplotlib/matplotlib/issues/11155
"""
import matplotlib.markers as mmarkers
if not ax:
ax = plt.gca()
sc = ax.scatter(x, y, **kw)
if (m is not None) and (len(m) == len(x)):
paths = []
for marker in m:
if isinstance(marker, mmarkers.MarkerStyle):
marker_obj = marker
else:
marker_obj = mmarkers.MarkerStyle(marker)
path = marker_obj.get_path().transformed(marker_obj.get_transform())
paths.append(path)
sc.set_paths(paths)
return sc
# Set up some sample data
data = {'x': np.arange(10).astype(int),
'y': 3 * np.arange(10),
'z': np.arange(10)}
df = pd.DataFrame(data=data)
# Set markers: even y-values to o, odd y values to x, divisible by 4 to diamond
df['m'] = 'o'
df.loc[df['y'] % 2 != 0, 'm'] = 'x'
df.loc[df['y'] % 4 == 0, 'm'] = 'D'
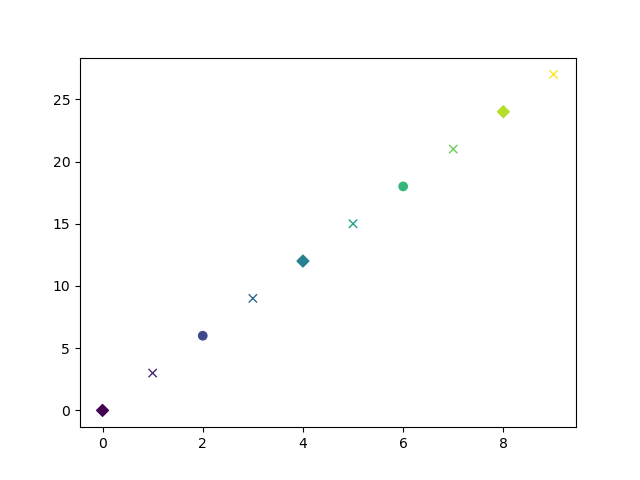
# Plotting this works fine
mscatter(df['x'], df['y'], c=df['z'], m=df['m'])
plt.show()
This gives the following plot:
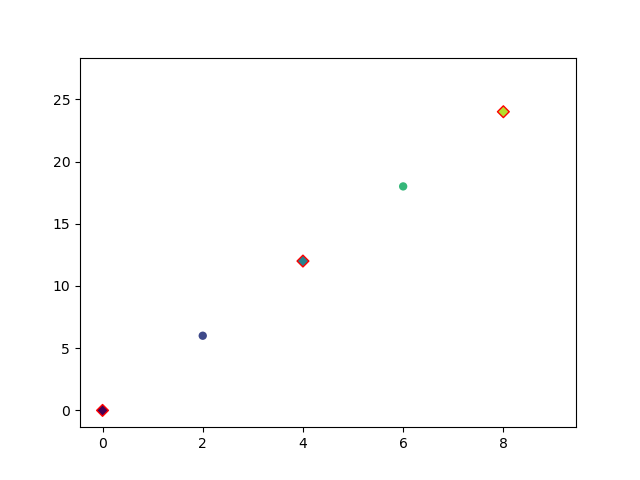
Now I’d like to highlight the diamonds with red edges. To do so, I make a new array of edgecolours.
# Set edgecolors
df['ecols'] = 'None'  # <-- Want to initialise all to 'face' but doesn't work
df.loc[df['m'] == 'D', 'ecols'] = 'r'

# Non-filled markers like x disappear
mscatter(df['x'], df['y'], c=df['z'], m=df['m'], edgecolors=df['ecols'])
plt.show()
And now the x markers disappear and circle markers get smaller. I will post the image below, as I can only upload one image at a time as a new user, it seems.
How could I restore the x markers and the edgecolours of the circles? Instead of 'none', it figured it might be possible to set the edgecolours based on df['z'] instead, but I’m not sure how’s it is scaled internally.
For the example above, I initialised the edgecolors to 'none' as setting it to 'face' produces ValueError: Invalid RGBA argument: 'face' - which I presume is causing the edges to be coloured white. It would be nice if this could be passed through instead of an RGBA value, to avoid the need to calculate each edgecolour.
I’d appreciate any insights! Thank you.
Tim
P.S. Is there a difference between 'None' and 'none'?