Dear Matplotlib-Users.
After changing the scaling from the y-axis from default to semilogy the tickers were not updated anymore automatically when a zoom is applied.
Even after deep searches within the ticker API as well as the mail archive list I could not find an appropriate solution for this.
In the original artist/image (sorry for confused usage of this termini, I am pretty new to matplotlib): the scale has a default log10-base with major tickers including labels and minor tickers without (guess this is the default ticker formatting).
I was messing around a lot with autoscale(enable=True,axis='both') and set_autoscale_on(True) and relim(). But actually the sovereign handling ot this API is still missing for me and I was not able to solve the problem.
Thanks in advance for your help.
Kindly regards,
Thore Oltersdorf
Thore,
I cannot reproduce your problem as I understand it. Could you please attach a copy of the image that shows the incorrect labeling?
Ben Root
···
On Wed, Feb 9, 2011 at 5:08 AM, Thore Oltersdorf <thore.oltersdorf@…3436…> wrote:
Dear Matplotlib-Users.
After changing the scaling from the y-axis from default to semilogy the
tickers were not updated anymore automatically when a zoom is applied.
Even after deep searches within the ticker API as well as the mail
archive list I could not find an appropriate solution for this.
In the original artist/image (sorry for confused usage of this termini,
I am pretty new to matplotlib): the scale has a default log10-base with
major tickers including labels and minor tickers without (guess this is
the default ticker formatting).
I was messing around a lot with autoscale(enable=True,axis=‘both’) and
set_autoscale_on(True) and relim(). But actually the sovereign handling
ot this API is still missing for me and I was not able to solve the problem.
Thanks in advance for your help.
Kindly regards,
Thore Oltersdorf
Dear Benjamin.
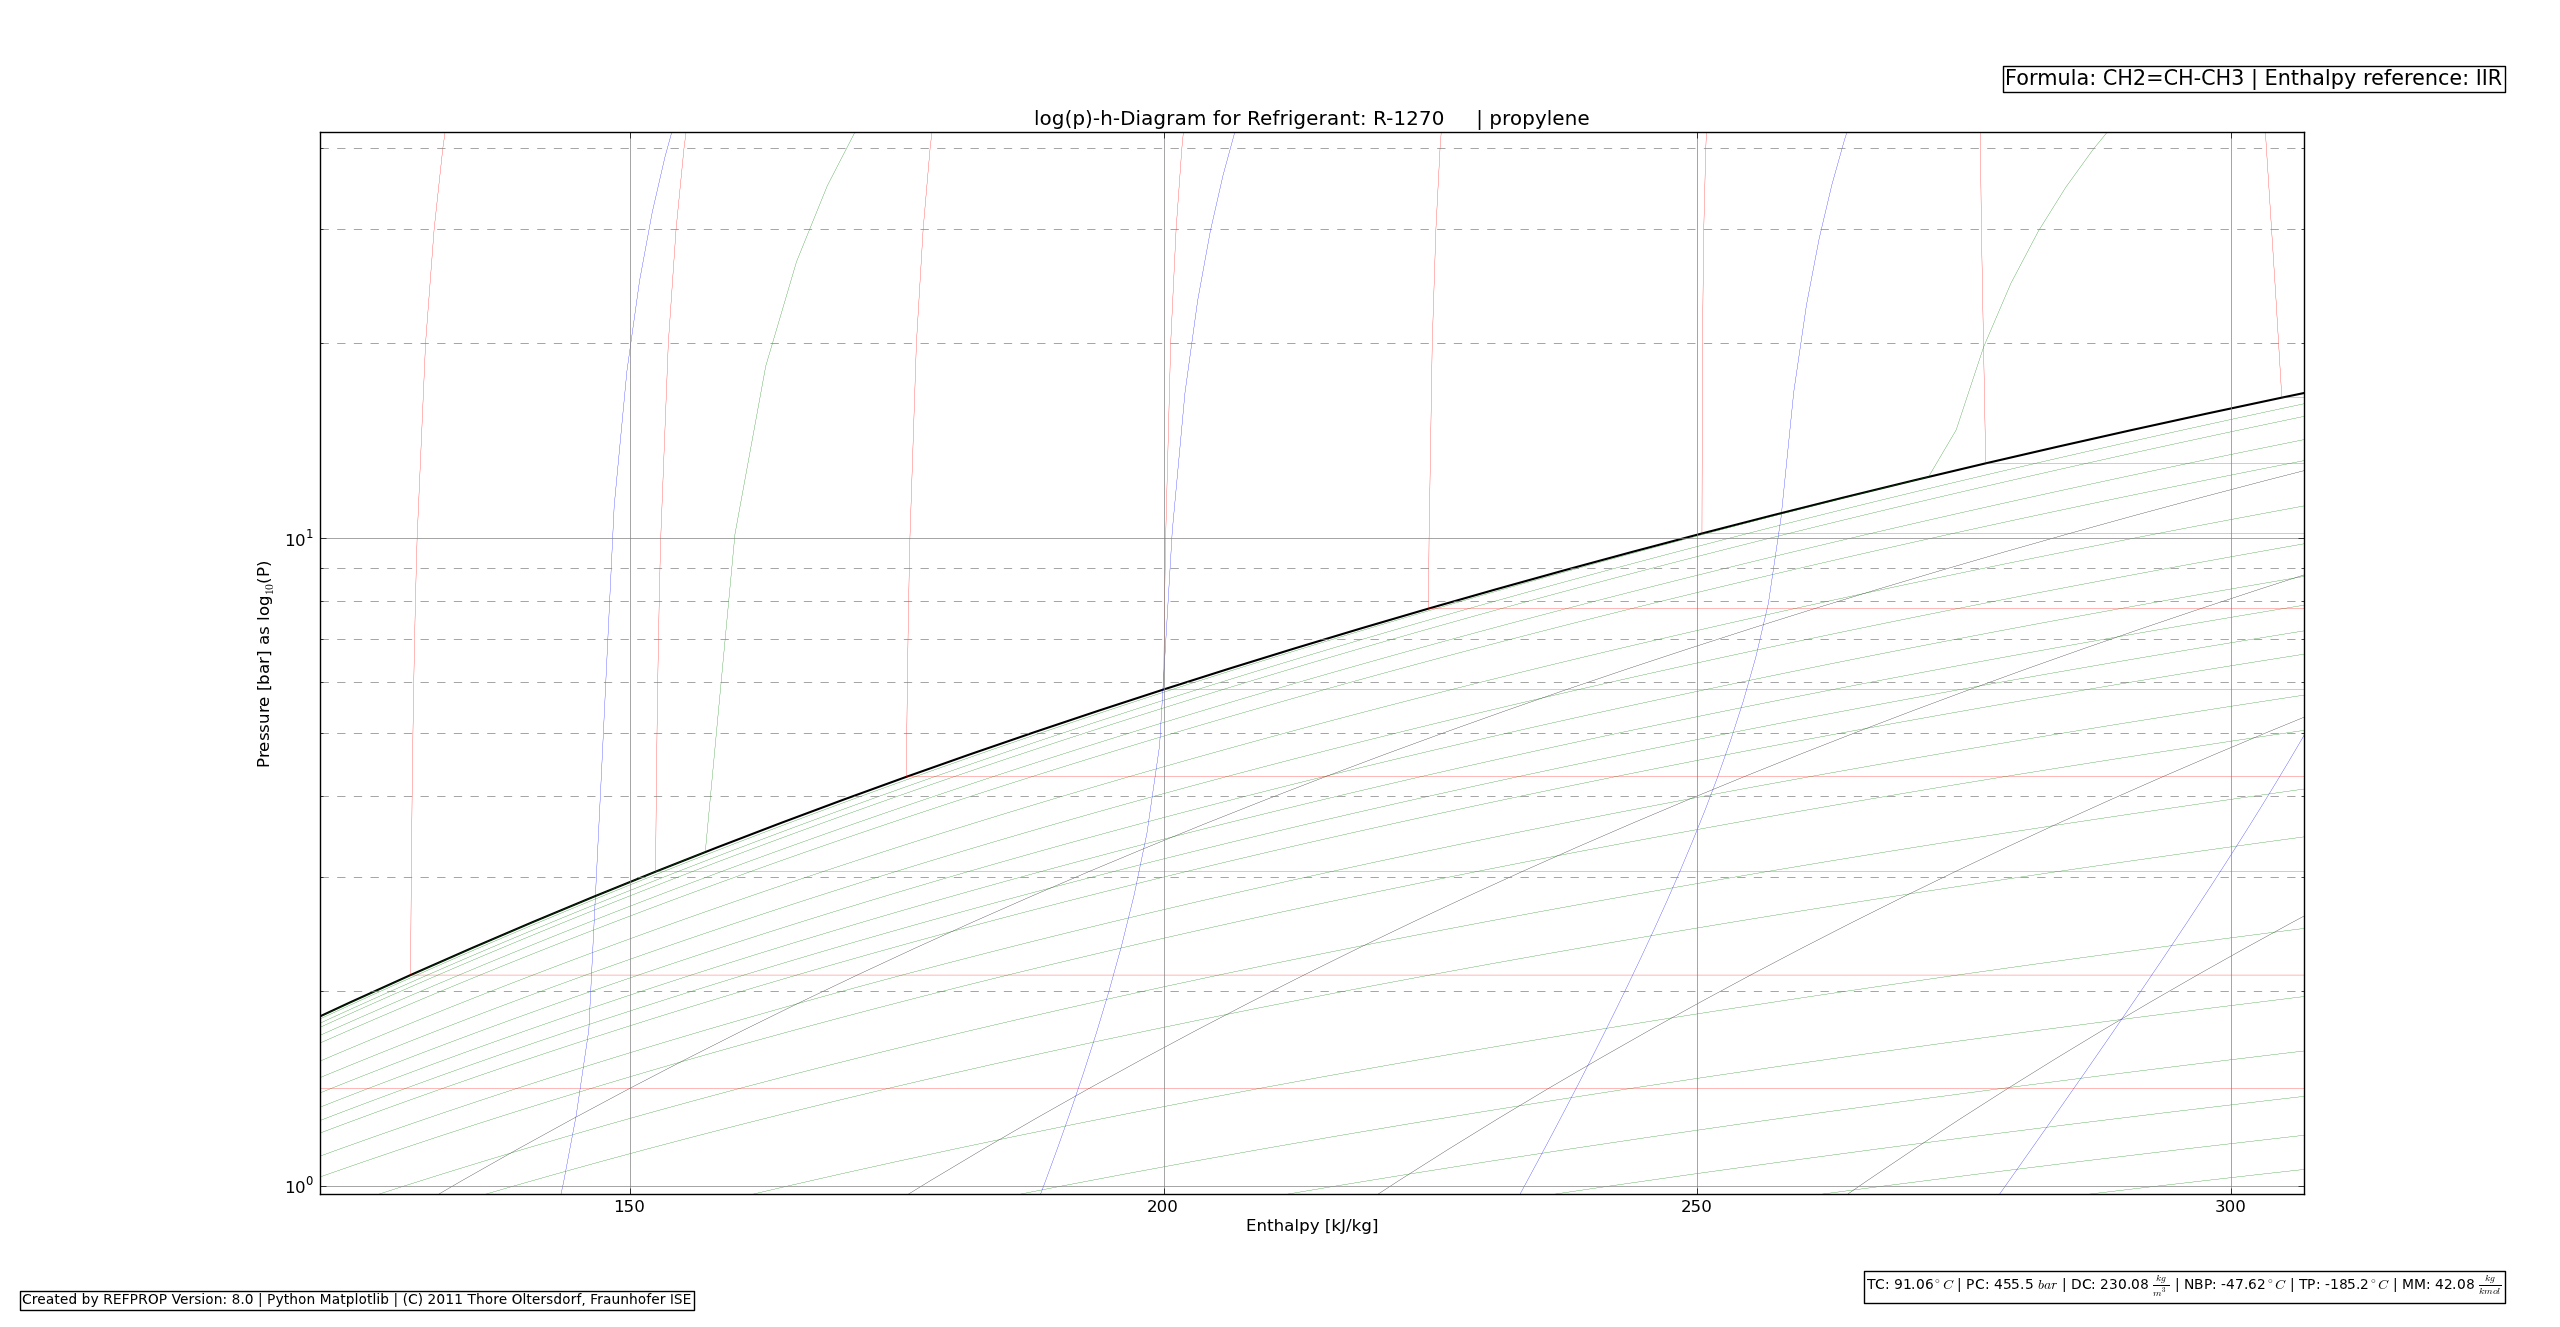
Attached you find the same graph as for the other problem regarding the inline annotations. But now zoomed once to reproduce the correctly scaled x-axis but not autoscaled y-axis.
Kindly regards,
Thore
Benjamin Root schrieb:
···
On Wed, Feb 9, 2011 at 5:08 AM, Thore Oltersdorf < > thore.oltersdorf@...3436...> wrote:
Dear Matplotlib-Users.
After changing the scaling from the y-axis from default to semilogy the
tickers were not updated anymore automatically when a zoom is applied.
Even after deep searches within the ticker API as well as the mail
archive list I could not find an appropriate solution for this.
In the original artist/image (sorry for confused usage of this termini,
I am pretty new to matplotlib): the scale has a default log10-base with
major tickers including labels and minor tickers without (guess this is
the default ticker formatting).
I was messing around a lot with autoscale(enable=True,axis='both') and
set_autoscale_on(True) and relim(). But actually the sovereign handling
ot this API is still missing for me and I was not able to solve the
problem.
Thanks in advance for your help.
Kindly regards,
Thore Oltersdorf
Thore,
I cannot reproduce your problem as I understand it. Could you please attach
a copy of the image that shows the incorrect labeling?
Ben Root
--
Dipl.-Ing. Thore Oltersdorf
Solar Building Group
Dept. Thermal Systems and Buildings
Fraunhofer-Institut f�r Solare Energiesysteme ISE
Heidenhofstrasse 2, 79110 Freiburg, Germany
Phone: +49 (0)761/4588-5239 Fax: +49 (0)761/4588-9239
thore.oltersdorf--<1!at!1>--ise.fraunhofer.de
http://HLK.ise.fraunhofer.de
Thore,
I do not see a problem with the attached graph. The graph looks correct to me. How is it different from what you expected to see?
Ben Root
···
On Wed, Feb 9, 2011 at 1:17 PM, Thore Oltersdorf <thore.oltersdorf@…3436…> wrote:
Dear Benjamin.
Attached you find the same graph as for the other problem regarding the inline annotations. But now zoomed once to reproduce the correctly scaled x-axis but not autoscaled y-axis.
Kindly regards,
Thore
Dear Benjamin.
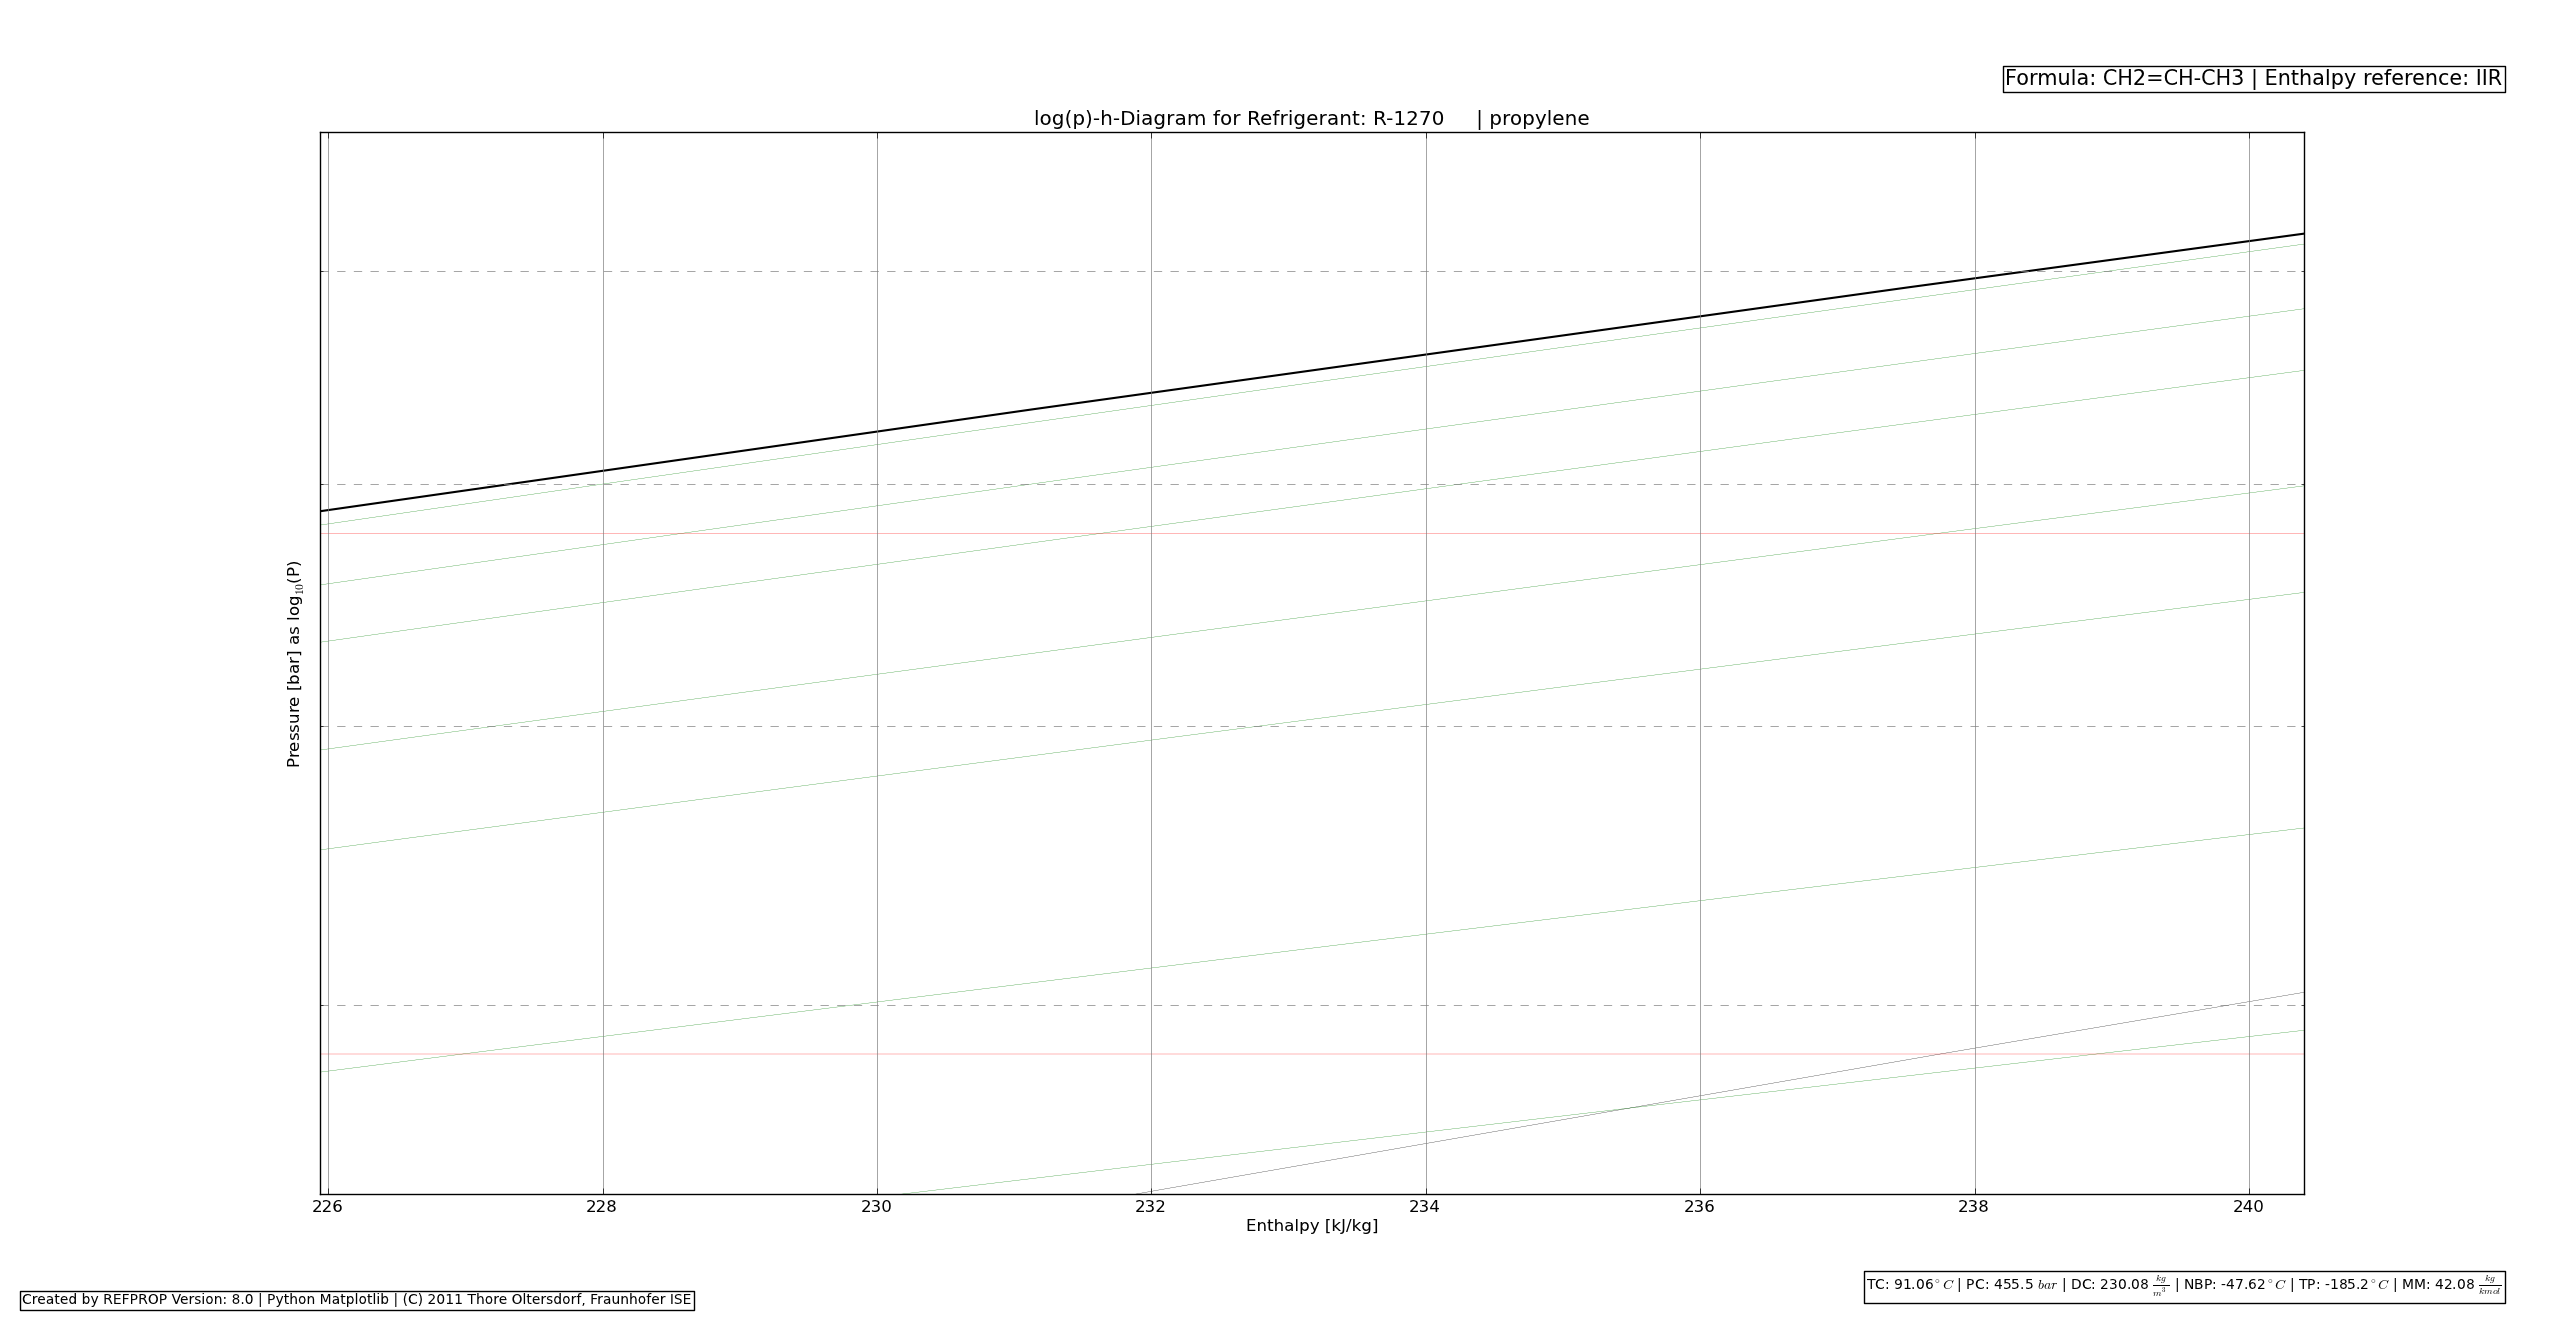
Okay. Now I attached almost the same zoomed region but zoomed twice to a very tiny area thus you can see that even the minor tickers have vanished on the y-axis.
My question: how do I need to set the y-axis minor (probably major tickers, too) to see anything from the grid as well as the tickers itself.
Kindly regards,
Thore
Benjamin Root schrieb:
···
On Wed, Feb 9, 2011 at 1:17 PM, Thore Oltersdorf < > thore.oltersdorf@...3436...> wrote:
Dear Benjamin.
Attached you find the same graph as for the other problem regarding the
inline annotations. But now zoomed once to reproduce the correctly scaled
x-axis but not autoscaled y-axis.
Kindly regards,
Thore
Thore,
I do not see a problem with the attached graph. The graph looks correct to
me. How is it different from what you expected to see?
Ben Root
--
Dipl.-Ing. Thore Oltersdorf
Solar Building Group
Dept. Thermal Systems and Buildings
Fraunhofer-Institut f�r Solare Energiesysteme ISE
Heidenhofstrasse 2, 79110 Freiburg, Germany
Phone: +49 (0)761/4588-5239 Fax: +49 (0)761/4588-9239
thore.oltersdorf--<1!at!1>--ise.fraunhofer.de
http://HLK.ise.fraunhofer.de