It sounds like you were using the right approach, you just got a bit lost on what some of the keyword parameters to annotate, etc do.
Here’s an example that should do what you want:
import matplotlib.pyplot as plt
from matplotlib.ticker import MultipleLocator
fig, ax = plt.subplots()
Set the axis limits as you wanted…
ax.set_ylim([-0.6, 1.1])
Set major and minor tick intervals
We could just set the tick locations manually, but this way you’ll keep the
same intervals when you zoom/pan/etc.
ax.yaxis.set_major_locator(MultipleLocator(1))
ax.yaxis.set_minor_locator(MultipleLocator(0.1))
Make the bottom spine “float” instead of being at the bottom of the plot
ax.spines[‘bottom’].set_position((‘data’, 0))
Hide the top and right spines (Similar to your sketch)
for position in [‘right’, ‘top’]:
ax.spines[position].set_visible(False)
Turn off the top, right, and bottom major and minor ticks (as in your sketch)
ax.tick_params(which=‘both’, top=False, right=False, bottom=False,
labelbottom=False)
Draw a 15 point long arrow that will always be at the top-left corner of
the axes. The key is that we’re specifying a location of (0,1) in
“axes fraction” coordinates. We then place an empty text string 15 points
above this (the xytext parameter controls the amount, textcoords controls
how it’s interpreted). Then, we draw an arrow connecting the top left corner
of the axes to the (empty and not drawn) text string.
ax.annotate(‘’, xy=(0,1), xycoords=‘axes fraction’, xytext=(0,15),
textcoords=‘offset points’, ha=‘center’,
arrowprops=dict(arrowstyle=‘<|-’, shrinkA=0, shrinkB=0,
facecolor='black'))
plt.show()
Hope that helps!
-Joe
···
On Fri, Jun 15, 2012 at 7:34 AM, Asbach, Mark <mark.asbach@…4111…> wrote:
Hi there,
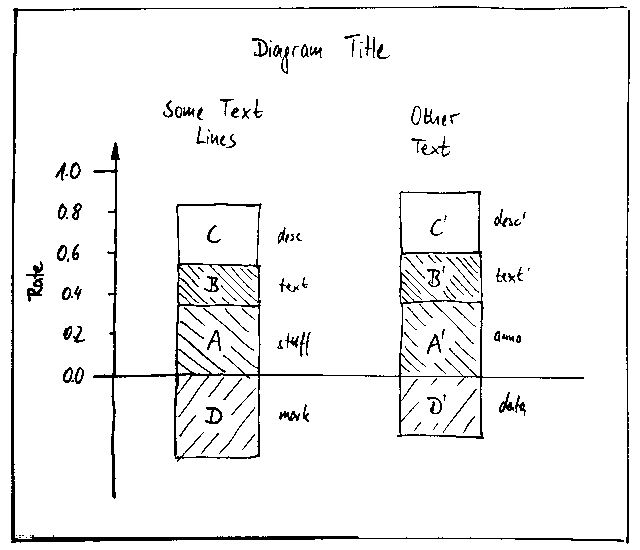
I’m sorry to ask such a newbie question, but I’d like to format a custom box plot and although there are numerous examples on the web and tons of docstrings in matplotlib, I’m stuck somehow. My problems center around axes / spines. In detail, my problems are:
- I want an y-axis on the left that spans from -0.6 to 1.1, ends in an arrow, has major ticks at 0 and 1 and minor ticks at [0.1…0.9]
As far as I understand, there is no option to let spines end in an arrow head, so I have to draw the myself. I get the ticks to appear at the right positions and the y-range to be as desired - however, the spine line is not drawn over the full y-range, but
only where there is data in the diagram. Also, I copied the arrow annotation code blindly from an older post on this list, but do not understand how I can adapt the arrow head to appear at a data position (instead of at the corner of the Axes area). One problem
is, that I get ticks on the right although that spine was disabled.
- I want some kind of x-axis at y==0, without ticks and without arrow
Using some methods on the spines, I can disable the top spine and move the bottom spine to zero. However, as with the y-axis, I cannot control from where to where the line itself is drawn.
As attachments, you’ll find a hand sketch of what my graph should look like and matplotlib code that goes nearly all the way.
I would be very happy about a hint on how to fix the problems left.
Thanks an advance,
Mark
Live Security Virtual Conference
Exclusive live event will cover all the ways today’s security and
threat landscape has changed and how IT managers can respond. Discussions
will include endpoint security, mobile security and the latest in malware
threats. http://www.accelacomm.com/jaw/sfrnl04242012/114/50122263/
Matplotlib-users mailing list
Matplotlib-users@lists.sourceforge.net
https://lists.sourceforge.net/lists/listinfo/matplotlib-users