Dear Matplotlib users,
I have a fancy graph created in Origin that I want to emulate with
matplotlib:
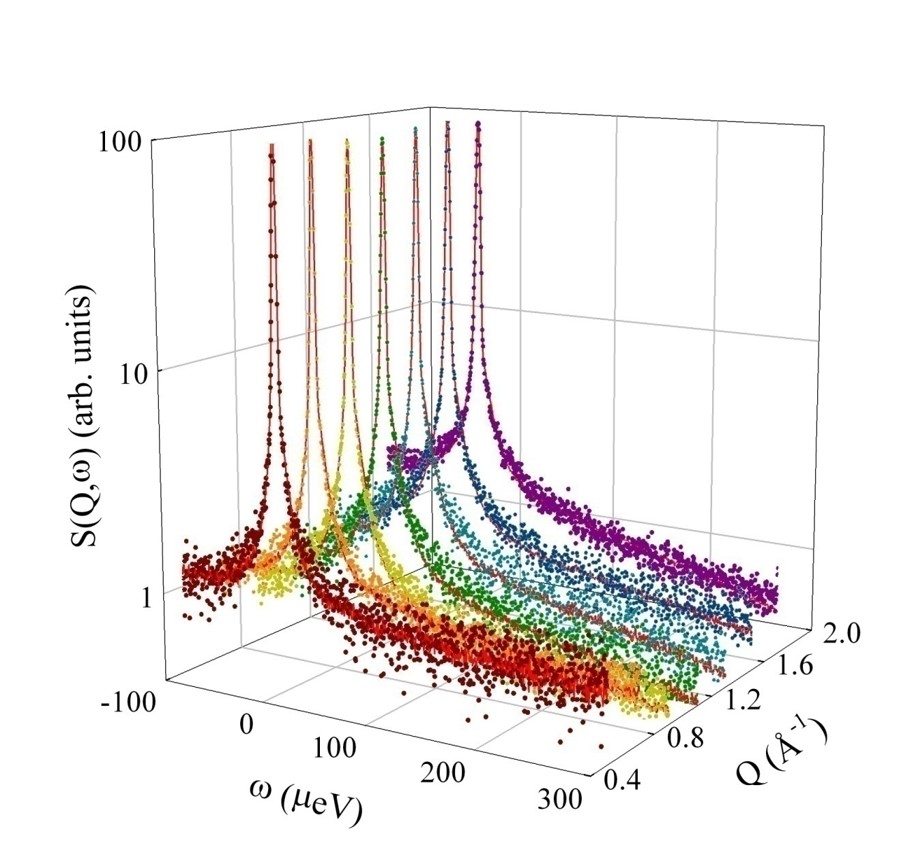
The curves S(Q,w) have each a constant value for Q, they are stacked along
the Q-axis. I'm a newbie with matplotlib, can you please give me some
pointers, like which classes should I employ to make this figure?
.Jose
?
-------------- next part --------------
An HTML attachment was scrubbed...
URL: <http://mail.python.org/pipermail/matplotlib-users/attachments/20160804/59036904/attachment-0001.html>
-------------- next part --------------
A non-text attachment was scrubbed...
Name: junk.jpg
Type: image/jpeg
Size: 134820 bytes
Desc: not available
URL: <http://mail.python.org/pipermail/matplotlib-users/attachments/20160804/59036904/attachment-0001.jpg>
The gallery is an excellent place to start for questions like these. Here
is the mplot3d section: http://matplotlib.org/gallery.html#mplot3d
Your figure is a combination of the 3d plot() calls for the line portions,
and 3d scatter() calls for the dots (see
http://matplotlib.org/examples/mplot3d/scatter3d_demo.html), and mathtext
for the labels (see
http://matplotlib.org/examples/pylab_examples/mathtext_demo.html). Let us
know if you have questions.
Cheers!
Ben Root
Dear Matplotlib users,
I have a fancy graph created in Origin that I want to emulate with
matplotlib:
The curves S(Q,w) have each a constant value for Q, they are stacked along
the Q-axis. I'm a newbie with matplotlib, can you please give me some
pointers, like which classes should I employ to make this figure?
.Jose
?
_______________________________________________
Matplotlib-users mailing list
Matplotlib-users at python.org
Matplotlib-users Info Page
-------------- next part --------------
An HTML attachment was scrubbed...
URL: <http://mail.python.org/pipermail/matplotlib-users/attachments/20160804/0bf27201/attachment-0001.html>
-------------- next part --------------
A non-text attachment was scrubbed...
Name: junk.jpg
Type: image/jpeg
Size: 134820 bytes
Desc: not available
URL: <http://mail.python.org/pipermail/matplotlib-users/attachments/20160804/0bf27201/attachment-0001.jpg>
···
On Thu, Aug 4, 2016 at 10:50 AM, Jose Borreguero <borreguero at gmail.com> wrote:
This is great Benjamin. Can you send the link to a similar gallery of image reading and display functions? I am especially interested in reading, writing and processing DICOM ultrasound images.
Thanks.
Dipu
Dipankar Ganguly
Consultant: Strategy/Technology/Commercialization
Bothell, WA
Cell: 408-203-8814
email: dipugee at gmail.com
http://www.linkedin.com/in/dipugee
···
On Aug 4, 2016, at 8:05 AM, Benjamin Root <ben.v.root at gmail.com> wrote:
The gallery is an excellent place to start for questions like these. Here is the mplot3d section: http://matplotlib.org/gallery.html#mplot3d
Your figure is a combination of the 3d plot() calls for the line portions, and 3d scatter() calls for the dots (see http://matplotlib.org/examples/mplot3d/scatter3d_demo.html), and mathtext for the labels (see http://matplotlib.org/examples/pylab_examples/mathtext_demo.html). Let us know if you have questions.
Cheers!
Ben Root
On Thu, Aug 4, 2016 at 10:50 AM, Jose Borreguero <borreguero at gmail.com <mailto:borreguero at gmail.com>> wrote:
Dear Matplotlib users,
I have a fancy graph created in Origin that I want to emulate with matplotlib:
<junk.jpg>
The curves S(Q,w) have each a constant value for Q, they are stacked along the Q-axis. I'm a newbie with matplotlib, can you please give me some pointers, like which classes should I employ to make this figure?
.Jose
?
_______________________________________________
Matplotlib-users mailing list
Matplotlib-users at python.org <mailto:Matplotlib-users at python.org>
Matplotlib-users Info Page
_______________________________________________
Matplotlib-users mailing list
Matplotlib-users at python.org
Matplotlib-users Info Page
-------------- next part --------------
An HTML attachment was scrubbed...
URL: <http://mail.python.org/pipermail/matplotlib-users/attachments/20160804/df386e78/attachment.html>
I have a newbie question?
What does this syntax really do? I would really like to understand the basic principles invoked here, especially the function of the ?.? separator. Is there a tutorial that will help me with such things?
Thanks.
Dipu
from matplotlib.pyplot import figure, show
Dipankar Ganguly
Consultant: Strategy/Technology/Commercialization
Bothell, WA
Cell: 408-203-8814
email: dipugee at gmail.com
http://www.linkedin.com/in/dipugee
···
On Aug 4, 2016, at 8:05 AM, Benjamin Root <ben.v.root at gmail.com> wrote:
The gallery is an excellent place to start for questions like these. Here is the mplot3d section: http://matplotlib.org/gallery.html#mplot3d
Your figure is a combination of the 3d plot() calls for the line portions, and 3d scatter() calls for the dots (see http://matplotlib.org/examples/mplot3d/scatter3d_demo.html), and mathtext for the labels (see http://matplotlib.org/examples/pylab_examples/mathtext_demo.html). Let us know if you have questions.
Cheers!
Ben Root
On Thu, Aug 4, 2016 at 10:50 AM, Jose Borreguero <borreguero at gmail.com <mailto:borreguero at gmail.com>> wrote:
Dear Matplotlib users,
I have a fancy graph created in Origin that I want to emulate with matplotlib:
<junk.jpg>
The curves S(Q,w) have each a constant value for Q, they are stacked along the Q-axis. I'm a newbie with matplotlib, can you please give me some pointers, like which classes should I employ to make this figure?
.Jose
?
_______________________________________________
Matplotlib-users mailing list
Matplotlib-users at python.org <mailto:Matplotlib-users at python.org>
Matplotlib-users Info Page
_______________________________________________
Matplotlib-users mailing list
Matplotlib-users at python.org
Matplotlib-users Info Page
-------------- next part --------------
An HTML attachment was scrubbed...
URL: <http://mail.python.org/pipermail/matplotlib-users/attachments/20160804/63185a81/attachment.html>
Dipu,
I think you would benefit from Software Carpentry lessons to give you a leg
up. It is geared towards scientists, but it should be useful none-the-less:
My personal recommendation for a book is O'Reilly's "Learning Python":
Learning Python, 5th Edition [Book]. I read this book during a
4 hour plane ride. I got on the plane with no python knowledge, and I came
off the plane with enough knowledge to understand the examples posted
online and ask specific questions on mailing lists.
I hope these suggestions are useful!
Ben Root
···
On Thu, Aug 4, 2016 at 11:22 AM, Dipankar ?Dipu? Ganguly <dipugee at gmail.com> wrote:
I have a newbie question?
What does this syntax really do? I would really like to understand the
basic principles invoked here, especially the function of the ?.?
separator. Is there a tutorial that will help me with such things?
Thanks.
Dipu
from matplotlib.pyplot import figure, show
Dipankar Ganguly
Consultant: Strategy/Technology/Commercialization
Bothell, WA
Cell: 408-203-8814
email: dipugee at gmail.com
Dipankar (Dipu) Ganguly - Chief Strategic Advisor - Januity | LinkedIn
On Aug 4, 2016, at 8:05 AM, Benjamin Root <ben.v.root at gmail.com> wrote:
The gallery is an excellent place to start for questions like these. Here
is the mplot3d section: http://matplotlib.org/gallery.html#mplot3d
Your figure is a combination of the 3d plot() calls for the line portions,
and 3d scatter() calls for the dots (see http://matplotlib.org/
examples/mplot3d/scatter3d_demo.html), and mathtext for the labels (see
http://matplotlib.org/examples/pylab_examples/mathtext_demo.html). Let us
know if you have questions.
Cheers!
Ben Root
On Thu, Aug 4, 2016 at 10:50 AM, Jose Borreguero <borreguero at gmail.com> > wrote:
Dear Matplotlib users,
I have a fancy graph created in Origin that I want to emulate with
matplotlib:
<junk.jpg>
The curves S(Q,w) have each a constant value for Q, they are stacked
along the Q-axis. I'm a newbie with matplotlib, can you please give me some
pointers, like which classes should I employ to make this figure?
.Jose
?
_______________________________________________
Matplotlib-users mailing list
Matplotlib-users at python.org
Matplotlib-users Info Page
_______________________________________________
Matplotlib-users mailing list
Matplotlib-users at python.org
Matplotlib-users Info Page
-------------- next part --------------
An HTML attachment was scrubbed...
URL: <http://mail.python.org/pipermail/matplotlib-users/attachments/20160804/326666d8/attachment.html>