I am trying to create a graph similar to the image attached, essentially I want to create a heatmap style graph but with piecharts instead. Do you guys have any idea on how to achieve this?
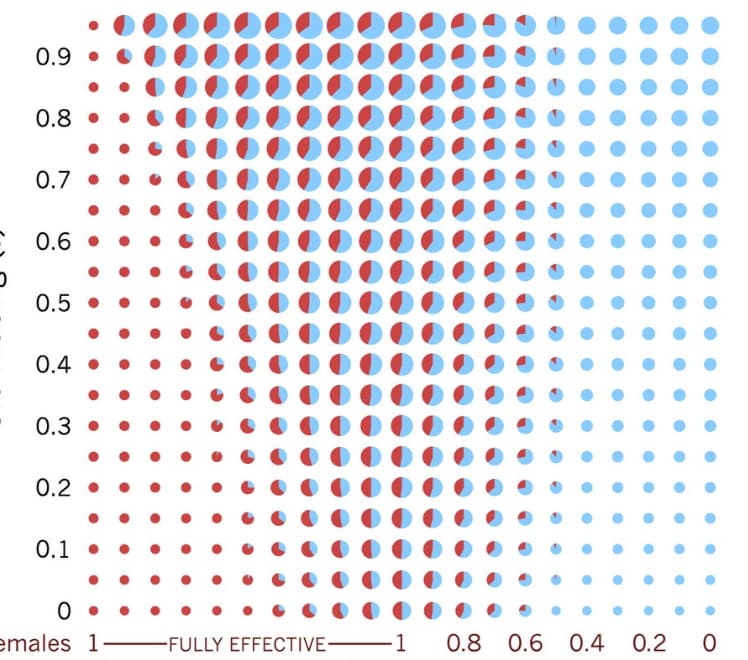
matplotlib.pyplot.pie — Matplotlib 3.7.1 documentation has a center and radius argument. You just need to call it m*n times.