Hi all,
Just to follow up, I wrote the following helper function to put a single colorbar to the right of a) an axes, b) a list of axes, c) to the right of a gridspec. I was getting a little peeved with colorbar not working as I liked with subplots or gridspec, and this kind of does the trick for me for most of my use cases.
I’m probably not the world’s best python programmer so feel free to make clearer.
Cheers, Jody
def colorbarRight(pcm,ax,fig,shrink=0.7,width=0.025,gap=0.03,**kwargs):
‘’’
def colorbarRight(pcm,ax,fig,shrink=0.7,width=0.05,gap=0.02)
Position colorbar to the right of axis ‘ax’ with colors from artist pcm.
ax can be an array of axes such as that returned by “subplots”.
ax can also be a GridSpec, in which case the colorbar is centered to the
right of the grid.
Defaults might no leave enough room for the colorbar on the right side, so
you should probably use subplots_adjust() or gridspec_update() to make more
space to the right:
with subplots:
import matplotlib.pyplot as plt
fig,ax=plt.subplots(2,2)
fig.subplots_adjust(right=0.87)
for axx in ax.flatten():
pcm=axx.pcolormesh(rand(10,10))
colorbarRight(pcm,ax,fig,extend=‘max’)
with gridspec:
import matplotlib.gridspec
import matplotlib.pyplot as plt
fig=plt.figure()
gs = gridspec.GridSpec(2,2)
gs.update(right=0.87)
for ii in range(2):
for jj in range(2):
ax=plt.subplot(gs[ii,jj])
pcm=ax.pcolormesh(rand(10,10))
colorbarRight(pcm,gs,fig,extend=‘max’)
‘’’
import numpy as np
if type(ax) is matplotlib.gridspec.GridSpec:
gridspecs are different than axes:
pos = ax.get_grid_positions(fig)
y0 = pos[0][-1]
y1 = pos[1][0]
x1 = pos[3][-1]
else:
if ~(type(ax) is np.ndarray):
these are supposedly axes:
ax=np.array(ax)
get max x1, min y0 and max y1
y1 = 0.
y0 = 1.
x1=0.
for axx in ax.flatten():
pos=axx.get_position()
x1=np.max([pos.x1,x1])
y1=np.max([pos.y1,y1])
y0=np.min([pos.y0,y0])
height = y1-y0
pos2 = [x1 + gap, y0 + (1.-shrink)height/2., width, heightshrink]
cax=axes(position=pos2)
fig.colorbar(pcm,cax=cax,**kwargs)
···
On Sat, Mar 7, 2015 at 5:21 AM, Jody Klymak <jklymak@…4192…> wrote:
Hi,
I guess I don’t understand the “[axx for axx in ax.flat]” command, but this steals from all the axes.
Cheers, Jody
fig,ax = plt.subplots(2,2)
for i in range(2):
for j in range(2):

    im=ax[i,j].imshow(np.ones((20,20)))

    im.set_clim([-1.,2.])
cax,kw = mpl.colorbar.make_axes([axx for axx in ax.flat],shrink=0.5)
plt.colorbar(im, cax=cax, **kw)
On Mar 6, 2015, at 9:39 AM, Eric Firing <efiring@…202…> wrote:
On 2015/03/05 11:36 PM, Dyah rahayu martiningrum wrote:
Hello all,
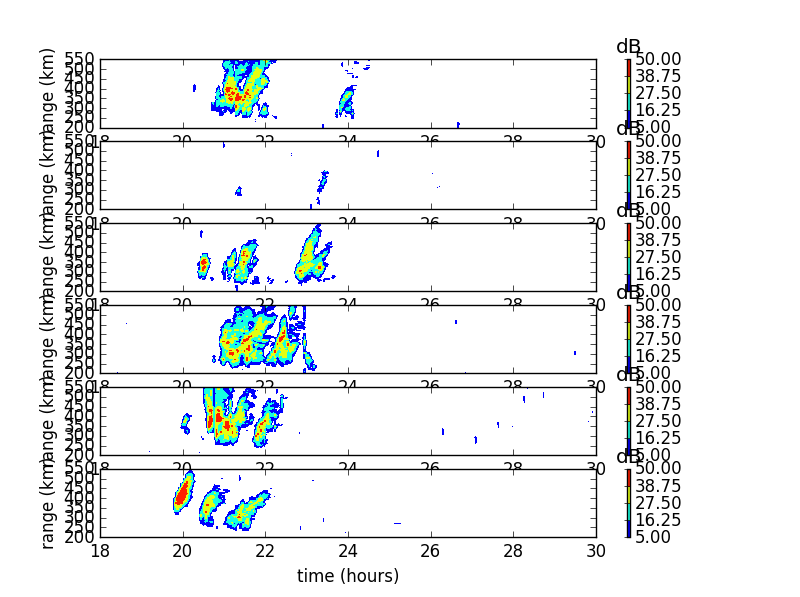
I make multi plot with colorbars. I need help, how do make only one
colorbar for six panels? I also want to show only lowest x-axis. I copy
my recent code and figure here.
An old example of something like this is here:
http://matplotlib.org/examples/pylab_examples/multi_image.html
Eric
Dive into the World of Parallel Programming The Go Parallel Website, sponsored
by Intel and developed in partnership with Slashdot Media, is your hub for all
things parallel software development, from weekly thought leadership blogs to
news, videos, case studies, tutorials and more. Take a look and join the
conversation now. http://goparallel.sourceforge.net/
Matplotlib-users mailing list
[email protected]
https://lists.sourceforge.net/lists/listinfo/matplotlib-users
–
===============================================
Dyah R Martiningrum
Student at Department of Communications and Computer Engineering
Graduate School of Informatics, Kyoto University
RISH, Gokasho, Uji shi, Kyoto, 611-0011, Japan.
Office : +81 0774 38 3856
Mobile : +81 090 6676 1981
===============================================