Hi,
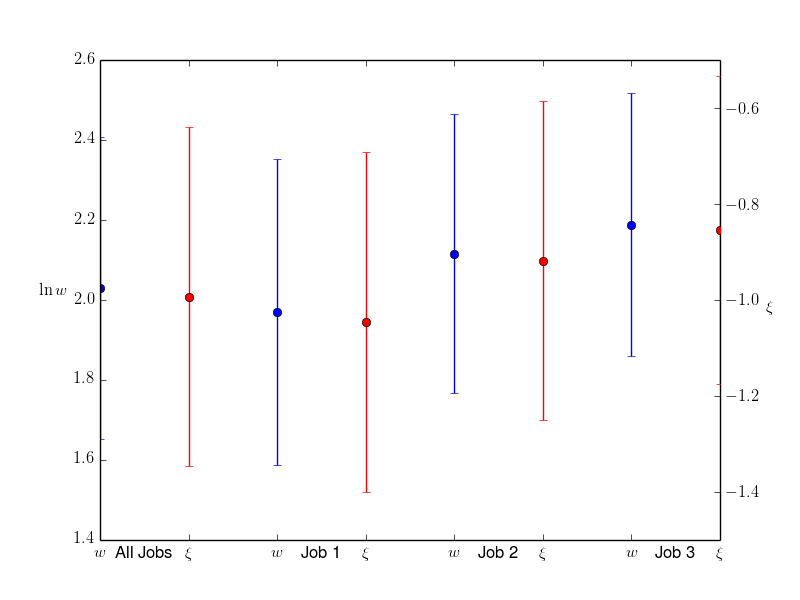
I'm trying to set two lines of xtick_labels But I can't figure out how
to get them on separate lines. These are for errorbars where I have two
variables for each of four categories. Using the following code, I'm
able to create the attached figure. How does one move the "minor"
xtick_labels to a 2nd line? A minor problem that maybe someone knows
the answer to is, how do I increase the width of the x axis so that
there is some space before and after the first and last ticks?
(ax1.set_xlim(-.5,7.5) does not seem to work.)
Many thanks,
Ted
fig,ax1=plt.subplots()
ax1.errorbar(wageAllTypes.index,wageAllTypes['mean'],yerr=wageAllTypes['sd'],fmt='bo')
xticks=[0,1,2,3,4,5,6,7]
xticks_minor=[.5,2.5,4.5,6.5]
ax1.set_xticks(xticks)
ax1.set_xticks(xticks_minor, minor=True)
ax1.set_xticklabels(['All Jobs','Job 1','Job 2','Job 3'],minor=True)
ax1.set_xticklabels([r'w',r'\\xi',r'w',r'\\xi',r'w',r'\\xi',r'w',r'\\xi]')
ax1.tick_params(axis='x',which='major')
ax1.tick_params(axis='x',which='minor',bottom='off',top='off')
ax1.set_ylabel(r'\\ln w',ha='right',rotation='horizontal')
ax2 = ax1.twinx()
ax2.errorbar(xiAllTypes.index,xiAllTypes['mean'],yerr=xiAllTypes['sd'],fmt='ro')
ax2.set_ylabel(r'\\xi',ha='left',rotation='horizontal')