Hello,
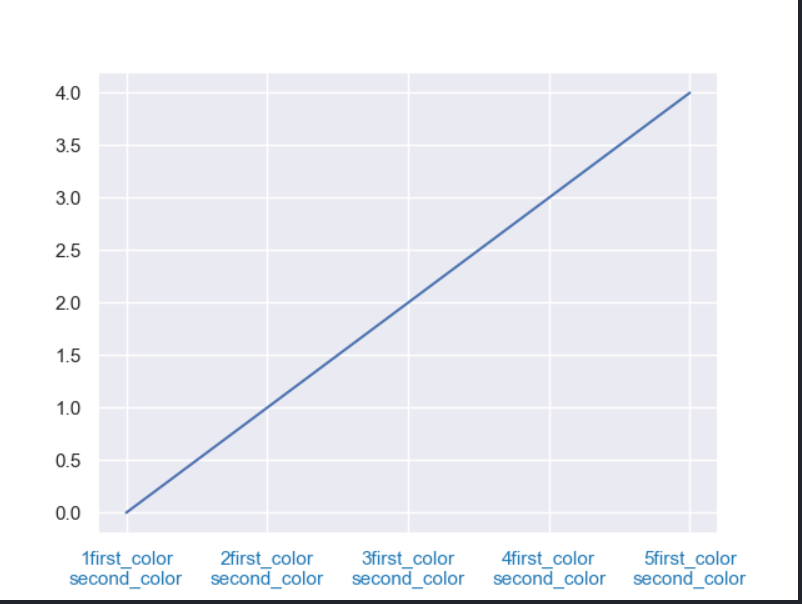
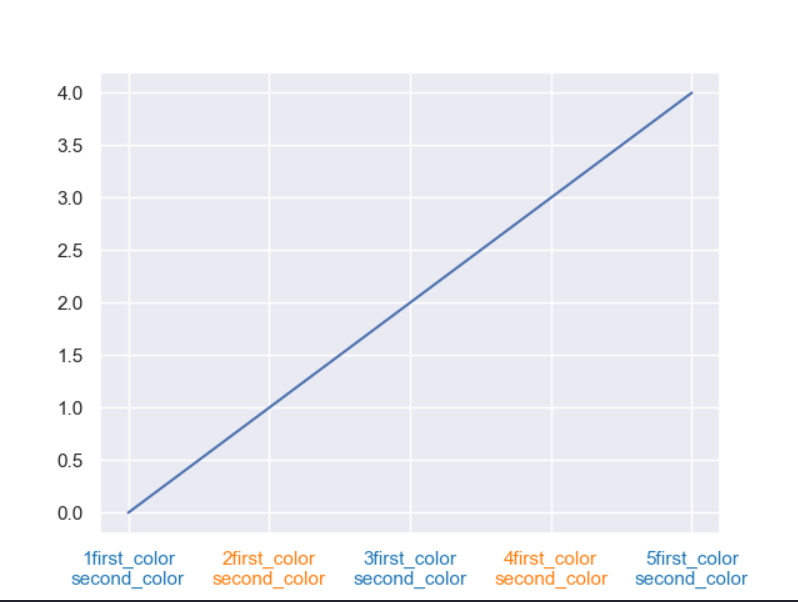
I am looking to generate a figure that each label has 2 colors. For example, a label named ‘first_color\nsecond_color’, first and second color are different. If I use label.set_color(colors[0]), the whole color of label will be changed. If I use label.set_color(colors[i % 2]), the color of neighboring label will be different. I just want different color in single internal label.
labels = ['1first_color\nsecond_color', '2first_color\nsecond_color', '3first_color\nsecond_color',
          '4first_color\nsecond_color', '5first_color\nsecond_color']
colors = [sns.color_palette('tab10')[0], sns.color_palette('tab10')[1]]

plt.plot(range(len(labels)), [0, 1, 2, 3, 4])


plt.xticks(range(len(labels)), labels)
for i, label in enumerate(plt.gca().get_xticklabels()):


    label.set_color(colors[0])

    #label.set_color(colors[i % 2])
I am sure there is support for such a feature in Matplotlib. I did look through the docs/forums but could not find much help.
Any suggestions will be much appreciated.