I've been working on a laboratory in which we can fruitfully discuss,
test, implement mpl1 design issues. I am a big fan of
python-as-modeling-language approach to design. I have tried to solve
from the ground up some of the design flaws in matplotlib -- the
transformation architecture and the data model, in which transformed
data is pushed to the backend with every draw. The goal was to get a
single file of pure python so people can get their heads around the
code in one place, and experiment w/o having to go through a
compile/install cycle. You will need the latest svn matplotlib and
the latest svn enthought traits 2 -- see the header of mpl1/mtraits.py
for install instructions for the latter.
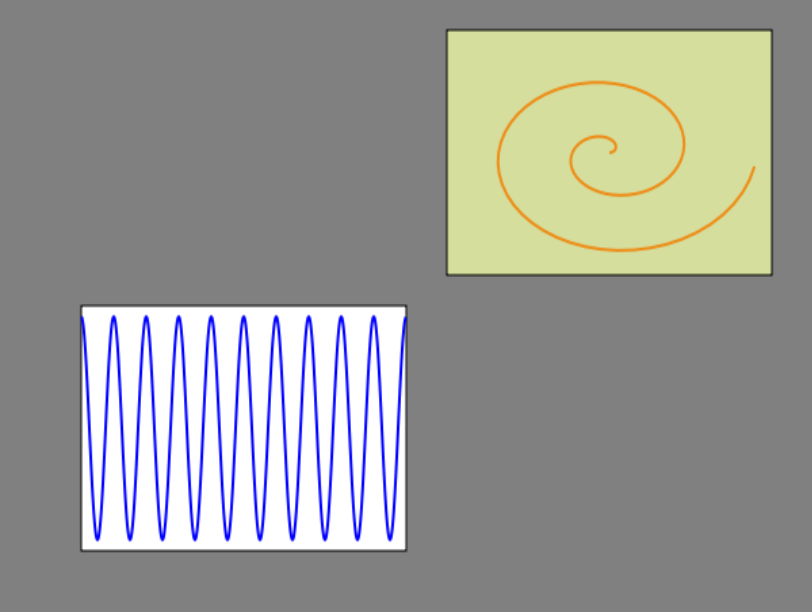
The sketch is in mpl1/mpl1.py in matplotlib svn, and it does produce a
graph (see attached). Right now only path drawing is implemented. It
is now time to think about how to handle the Axis. We want to figure
out the right way to bundle and xaxis and a yaxis with an artist so
that we can support multiple y-axis etc on one Axes. Drawing axis
ticks also brings up another problem I have not figured out -- how to
draw markers in points at data locations in the figure. matplotlib
uses some trickery in the transforms (transoffset and friends)
designed to handle this. An alternative that I am considering is
making a first class primitive called Markers, which have a list of
x,y locations, a marker path, an affine and some path properties. The
renderer can then cache the path and then draw markers in points in
the right place. I am open to other ideas, but this is my current
thinking.
Most of the effort here has been trying to get the transformations
right, so please give me feedback and or make corrections and
suggestions -- I'm not wild about the naming either, so feel free to
come up with something better. There is also the question of whether
we want to pay up and use 4x4 from the ground up and just ignore the
3rd dimension to open the door for 3D support. My inclination is
probably not, but I am open to ideas.
Included below is the "DESIGN_GOALS" document, also in mpl1 svn::
Here are some of the things I would like to accomplish with mpl1. Any
and all of this is open to discussion. What I present below is pretty
ambitious, so if there is support, we will need significant
contributions from several developers for several months. Ideally, we
would get a good sketch working, and then organize a spint (3-4 days?)
for late August, where we try get as far as possible to making this
viable.
= Data copying =
Push the data to the backend only once, or only when required. Update
the transforms in the backend, but do not push transformed data on
every draw. This is potentially a major win, because we currently
move the data around on every draw. Eg, see how mpl1.py handles pusing
the paths when the renderer is set (Figure.set_renderer) but on draw
commands (Figure.draw) only pushes the current affine.
= Transformations =
Support a normal transformation architecture. The current draft
implementation assumes one nonlinear transformation, which happens at
a high layer, and all transformations after that are affines. In the
mpl1 draft, there are three affines: the transformation from view
limits -> axes units (AxesCoords.affineview), the transformation from
axes units to normalized figure units (AxesCoords.affineaxes), and the
transformation from normalized figure units to display
(Renderer.affinerenderer)
Do we want to use 3x3 or 4x4 to leave the door open for 3D developers?
How do transformations (linear and nonlinear) play with Axis features
(ticking and gridding). The ideal is a framework in which ticking,
gridding and labeling work intelligently with arbitrary, user
supplied, transformations. What is the proper transformation API?
= Objects that talk to the backend "primitives" =
Have just a few, fairly rich obects, that the backends need to
understand. Clear candidates are a Path, Text and Image, but despite
their names, don't confuse these with the eponymous matplotlib
matplotlib Artists, which are higher level than what I'm thinking of
here (eg matplotlib.text.Text does *a lot* of layout, and this would
be offloaded ot the backend in this conception of the Text primitive).
Each of these will carry their metadata, eg a path will carry its
stroke color, facecolor, linewidth, etc..., and Text will carry its
font size, color, etc.... We may need some optimizations down the
road, but we should start small. For now, let's call these objects
"primitives".
This approach requires the backends to be smarter, but they have to
handle fewer entities.
= Where do the plot functions live? =
In matplotlib, the plot functions are matplotlib.axes.Axes methods and
I think there is consensus that this is a poor design. Where should
these live, what should they create, etc?
= How much of an intermediate artist layer do we need? =
Do we want to create high level objects like Circle, Rectangle and
Line, each of which manage a Path object under the hood? Probably,
for user convenience and general compability with matplotlib. By
using traits properly here, many current matplotlib Arists will be
thin interfaces around one or more primitives.
I think the whole matplotlib.collections module is poorly designed,
and should be chucked wholesale, in favor of faster, more elegant,
optimizations and special cases. Just having the right Path object
will reduce the need for many of these, eg LineCollection,
PolygonCollection, etc... Also, everything should be numpy enabled,
and the sequence-of-python-tuples approach that many of the
collections take should be dropped. Obviously some of the more useful
things there, like quad meshes, need to be ported and retained.
= Z-ordering, containers, etc =
Peter has been doing a lot of nice work on z-order and layers for
chaco, stuff that looks really useful for picking, interaction, etc...
We should look at this approach, and think carefully about how this
should be handled. Paul may be a good candidate for this, since he
has been working recently on the picking API.
= Extension code =
I would like to shed all of the CXX extension code -- it is just too
small a nitch in the python world to base our project on. SWIG is
pretty clearly the right choice. mpl1 will use numpy for
transformations with some carefully chosen extension code where
necessary, to get rid of _transforms.cpp. I also plan to use the SWIG
agg wrapper, so this gets rid of _backend_agg. If we can enhance the
SWIG agg wrapper, we can also do images through there, getting rid of
_image.cpp. Having a fully featured, python-exposed agg wrapper will
be a plus in mpl and beyond. But with the agg license change, I'm
open to discussion of other approaches.
The major missing piece in ft2font, which is a pretty elaborate CXX
module. Michael may want to consider alternatives, including looking
at the agg support for freetype, and the kiva/chaco approach.
I want to do away with *all* GUI extension code. This should live
outside MPL if at all, eg in a toolkit if we need it. This means
someone needs to figure out how to get TkInter talking to a python
buffer object or a numpy array. Maintaining the GUI extension code
across platforms is an unending headache.
= Traits =
I think we should make a major committment to traits and use them from
the ground up. Even without the UI stuff, they add plenty to make
them worthwhile, especially the validation and notification features.
With the UI (wx only) , they are a major win for many GUI developers.
Compare the logic for sharing an x-axis using matplotlib transforms
with Axes.sharex with the approach used in mpl1.py with sync_trait-ed
affines.
= Axis handling =
The whole concept of the Axes object needs to be rethought, in light
of the fact that we need to support multiple axis objects on one Axes.
The matplotlib implementation assumes 1 xaxis and 1 yaxis per Axes,
and we hack two y-axis support (examples/two_scales.py) with some
transform shenanigans via twinx and multiple Axes where one is hidden,
but the approach is not scalable and is unwieldy.
This will require a fair amount of thought, but we should aim for
supporting an arbitrary number of axis obects, presumably associated
with individual artists or primitives. They also need to be *much*
faster. matplotlib uses Artists for each tick, tickline, gridline,
ticklabel, etc, and this is mind-numbingly slow. I have a prototype
axis implementations that draws the ticks with a single path using
repeated MOVETO and LINETO, for example, which will be incomparably
faster than using a separate object for each tick.
The other important featiure for axis support is that, for the most
part, they should be arbitrarily placeable (eg a "detached" axis).
= Breakage =
I think we need to be prepared to break the hell out of matplotlib.
The API will basically be a significant rewrite. pylab will still
mostly work unchanged -- that is the beauty of pylab -- though API
calls on return objects may be badly broken. We can mitigate this pain
if we desire with clever wrapper objects, but once you start calling
methods on return objects, you join the community of power users, and
this is the community I'm most willing to inconvenience with breakage.
We'll probably want to install into a new namespace, eg "mpl", and
envision both matplotlib and mpl co-existing for some time. In fact,
mpl might depend on matplotlib initially, eg until a CXX-free ft2font
is available.
We should expect to be supporting and using matplotlib for a long
time, since the proposals discussed here imply that it will be a long
wait until mpl1 is feature complete with matplotlib. In fact, we could
rightly consider this to be the mpl2 proposal, and keep releasing
matplotlib ehancements to 1.0 and beyond w/o signfificant breakage.
It's a nominal difference so I don't really have a preference.
Or we could forget all this wild speculation and resume our normally
scheduled lives.
= Chaco and Kiva =
It is a good idea for an enterprising developer to take a careful look
at the current Chaco and Kiva to see if we can further integrate with
them. I am gun shy because they seem formiddable and complex, and one
of my major goals here is to streamline and simplify, but they are
incredible pieces of work and we need to carefully consider them,
especially as we integrate other parts of the enthought suite into our
core, eg traits, increasing the possibility of synergies.
= Unit handling, custom object types =
There is a legitimate need to be able to feed custom objects into
matplotlib. Recent versions of matplotlib support this with a unit
registry in the "units" module. A clear use case is plotting with
native python datetime objects, which is supported in 0.90 via the
unit handling, which should probably be called "custom object handling
and conversion". This is a deep and complicated subject, involving
questions of where the original data live, how they are converted to
useful types (arrays of floats) etc. It's worth thinking this about
as we discuss redesign issues.