Hi all,
From http://labix.org/python-dateutil
"To generate a rrule for the use case of "a date on the specified day of the month, unless it is beyond the end of month, in which case it will be the last day of the month" use the following:
rrule(MONTHLY, bymonthday=(some_day, -1), bysetpos=1)
This will generate a value for every calendar month regardless of the day of the month it is started from."
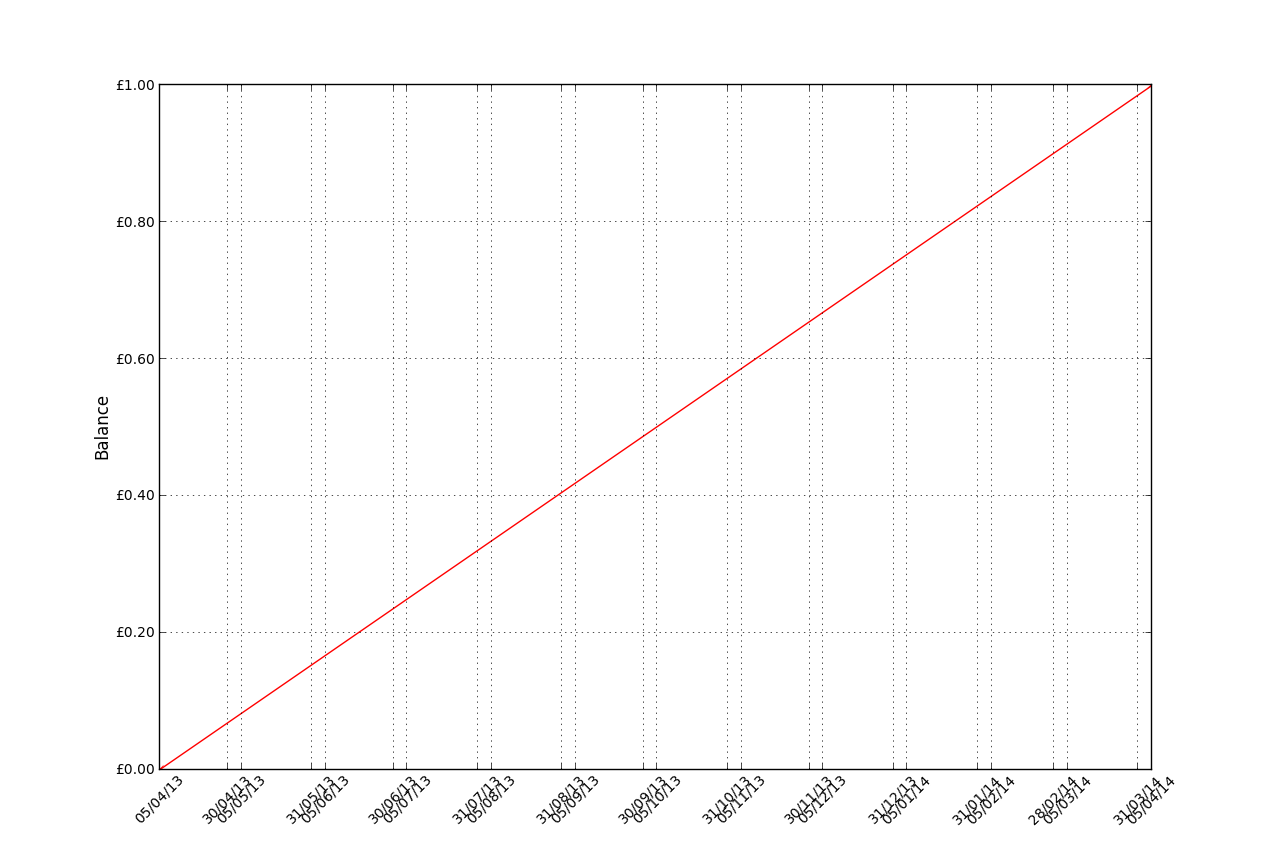
Using bymonthday with MonthLocator gives ticks on the day given and the last day of the month, which looks extremely ugly. Code below demonstrates.
from dateutil.rrule import *
import datetime
import matplotlib.pyplot as plt
from matplotlib.ticker import FormatStrFormatter, MultipleLocator
from matplotlib.dates import DateFormatter, MonthLocator, DayLocator
start = datetime.date(2013, 3, 29)
until = datetime.date(2014, 3, 29)
dates = rrule(MONTHLY, bymonthday=(29, -1), bysetpos=1, until=until)
for d in dates:print(d)
dates = [start, until]
values = [0, 1]
plt.ylabel('Balance')
plt.grid()
ax = plt.subplot(111)
plt.plot_date(dates, values, fmt = 'rx-')
ax.xaxis.set_major_locator(MonthLocator(bymonthday = (dates[0].day, -1)))
ax.xaxis.set_major_formatter(DateFormatter('%d/%m/%y'))
ax.yaxis.set_major_formatter(FormatStrFormatter('�%0.2f'))
ax.yaxis.set_minor_locator(MultipleLocator(5))
plt.axis(xmin=dates[0], xmax=dates[-1])
plt.setp(plt.gca().get_xticklabels(), rotation = 45, fontsize = 10)
plt.setp(plt.gca().get_yticklabels(), fontsize = 10)
plt.show()
···
--
If you're using GoogleCrap� please read this http://wiki.python.org/moin/GoogleGroupsPython.
Mark Lawrence