Nicolas
I get that too, (with your script and various things in my work).
But if you zoom in, the lines are in the right place. Is it
some kind of screen aliasing?
Jules
Nicolas
I get that too, (with your script and various things in my work).
But if you zoom in, the lines are in the right place. Is it
some kind of screen aliasing?
Jules
Thanks for testing.
If I zoom at any line cross, the lines are definitely at the wrong place for me.
As for screen aliasing I'm not sure since both the png and pdf seems to be wrong in my case.
Weird !
Nicolas
On Oct 29, 2012, at 15:40 , jules hummon wrote:
Nicolas
I get that too, (with your script and various things in my work).
But if you zoom in, the lines are in the right place. Is it
some kind of screen aliasing?Jules
------------------------------------------------------------------------------
The Windows 8 Center - In partnership with Sourceforge
Your idea - your app - 30 days.
Get started!
http://windows8center.sourceforge.net/
what-html-developers-need-to-know-about-coding-windows-8-metro-style-apps/
_______________________________________________
Matplotlib-devel mailing list
[email protected]
matplotlib-devel List Signup and Options
Which version of matplotlib are you using, just for reference.
Ben Root
On Mon, Oct 29, 2012 at 11:25 AM, Nicolas Rougier <Nicolas.Rougier@…922…> wrote:
Thanks for testing.
If I zoom at any line cross, the lines are definitely at the wrong place for me.
As for screen aliasing I’m not sure since both the png and pdf seems to be wrong in my case.
Weird !
matplotlib 1.2.x
python 2.7.2
osx 10.7.5
Nicolas
On Oct 29, 2012, at 16:29 , Benjamin Root wrote:
On Mon, Oct 29, 2012 at 11:25 AM, Nicolas Rougier <[email protected]......> wrote:
Thanks for testing.
If I zoom at any line cross, the lines are definitely at the wrong place for me.
As for screen aliasing I'm not sure since both the png and pdf seems to be wrong in my case.
Weird !Which version of matplotlib are you using, just for reference.
Ben Root
I also see this in mpl 1.1.0, python 2.7.2 with the iPython Qt console
and also with the WXAgg backend
Gary R.
On 30 October 2012 03:16, Nicolas Rougier <[email protected]...> wrote:
matplotlib 1.2.x
python 2.7.2
osx 10.7.5Nicolas
On Oct 29, 2012, at 16:29 , Benjamin Root wrote:
On Mon, Oct 29, 2012 at 11:25 AM, Nicolas Rougier <[email protected]...> wrote:
Thanks for testing.
If I zoom at any line cross, the lines are definitely at the wrong place for me.
As for screen aliasing I'm not sure since both the png and pdf seems to be wrong in my case.
Weird !Which version of matplotlib are you using, just for reference.
Ben Root
------------------------------------------------------------------------------
The Windows 8 Center - In partnership with Sourceforge
Your idea - your app - 30 days.
Get started!
http://windows8center.sourceforge.net/
what-html-developers-need-to-know-about-coding-windows-8-metro-style-apps/
_______________________________________________
Matplotlib-devel mailing list
[email protected]
matplotlib-devel List Signup and Options
Thanks for testing.
If I zoom at any line cross, the lines are definitely at the wrong place for me.
As jules hummon commented, I see lines in right places when I zoom in.
As for screen aliasing I'm not sure since both the png and pdf seems to be wrong in my case.
It still can be some aliasing-related issue. Note that with
interpolation="nearest", the images are rasterized with given dpi even
if you save the figure as pdf.
The agg backend tries to adjust the location of lines and images so
that they are well-aligned with the pixels, and the issue seems to be
related with that behavior.
In my case, using interpolation="none" worked out okay. So give it a try.
Regards,
-JJ
On Tue, Oct 30, 2012 at 12:25 AM, Nicolas Rougier <[email protected]...> wrote:
Weird !
Nicolas
On Oct 29, 2012, at 15:40 , jules hummon wrote:
Nicolas
I get that too, (with your script and various things in my work).
But if you zoom in, the lines are in the right place. Is it
some kind of screen aliasing?Jules
------------------------------------------------------------------------------
The Windows 8 Center - In partnership with Sourceforge
Your idea - your app - 30 days.
Get started!
http://windows8center.sourceforge.net/
what-html-developers-need-to-know-about-coding-windows-8-metro-style-apps/
_______________________________________________
Matplotlib-devel mailing list
[email protected]
matplotlib-devel List Signup and Options------------------------------------------------------------------------------
The Windows 8 Center - In partnership with Sourceforge
Your idea - your app - 30 days.
Get started!
http://windows8center.sourceforge.net/
what-html-developers-need-to-know-about-coding-windows-8-metro-style-apps/
_______________________________________________
Matplotlib-devel mailing list
[email protected]
matplotlib-devel List Signup and Options
You're right. Using 'none' interpolation seems to solve the problem. Good to know !
One last question, why is the 'none' interpolation restricted to Agg/PS/pdf ?
Nicolas
On Oct 30, 2012, at 6:53 , Jae-Joon Lee wrote:
On Tue, Oct 30, 2012 at 12:25 AM, Nicolas Rougier > <[email protected]...> wrote:
Thanks for testing.
If I zoom at any line cross, the lines are definitely at the wrong place for me.
As jules hummon commented, I see lines in right places when I zoom in.
As for screen aliasing I'm not sure since both the png and pdf seems to be wrong in my case.
It still can be some aliasing-related issue. Note that with
interpolation="nearest", the images are rasterized with given dpi even
if you save the figure as pdf.
The agg backend tries to adjust the location of lines and images so
that they are well-aligned with the pixels, and the issue seems to be
related with that behavior.In my case, using interpolation="none" worked out okay. So give it a try.
Regards,
-JJ
Weird !
Nicolas
On Oct 29, 2012, at 15:40 , jules hummon wrote:
Nicolas
I get that too, (with your script and various things in my work).
But if you zoom in, the lines are in the right place. Is it
some kind of screen aliasing?Jules
------------------------------------------------------------------------------
The Windows 8 Center - In partnership with Sourceforge
Your idea - your app - 30 days.
Get started!
http://windows8center.sourceforge.net/
what-html-developers-need-to-know-about-coding-windows-8-metro-style-apps/
_______________________________________________
Matplotlib-devel mailing list
[email protected]
matplotlib-devel List Signup and Options------------------------------------------------------------------------------
The Windows 8 Center - In partnership with Sourceforge
Your idea - your app - 30 days.
Get started!
http://windows8center.sourceforge.net/
what-html-developers-need-to-know-about-coding-windows-8-metro-style-apps/
_______________________________________________
Matplotlib-devel mailing list
[email protected]
matplotlib-devel List Signup and Options
Sorry, I was too fast in my reply.
When I save the figure, the png output is ok while the pdf is displaying some kind of interpolation with the image.
import numpy as np
import matplotlib
matplotlib.use('Agg')
import matplotlib.pyplot as plt
n = 16
fig = plt.figure(figsize=(6,6))
Z = np.array(([0,1]*(n//2) + [1,0]*(n//2))*(n//2)).reshape(n,n)
plt.imshow(Z, interpolation='none', cmap=plt.cm.gray, extent=[0,n,0,n], alpha=.25)
plt.xticks(np.arange(0,n), )
plt.yticks(np.arange(0,n), )
plt.grid(ls='solid')
plt.savefig('pylab-grid.png')
plt.savefig('pylab-grid.pdf')
plt.show()
Just for the record, "Skim", "Preview" and "Adobe Reader" on OSX do not give the same output on the saved pdf.
"Adobe Reader" displays the expected result (same as saved png) while "Preview" and "Skim" are apparently trying to make some (bad) interpolation of the checkboard image.
Nicolas
On Oct 30, 2012, at 7:52 , Nicolas Rougier wrote:
You're right. Using 'none' interpolation seems to solve the problem. Good to know !
One last question, why is the 'none' interpolation restricted to Agg/PS/pdf ?
Nicolas
On Oct 30, 2012, at 6:53 , Jae-Joon Lee wrote:
On Tue, Oct 30, 2012 at 12:25 AM, Nicolas Rougier >> <[email protected]...> wrote:
Thanks for testing.
If I zoom at any line cross, the lines are definitely at the wrong place for me.
As jules hummon commented, I see lines in right places when I zoom in.
As for screen aliasing I'm not sure since both the png and pdf seems to be wrong in my case.
It still can be some aliasing-related issue. Note that with
interpolation="nearest", the images are rasterized with given dpi even
if you save the figure as pdf.
The agg backend tries to adjust the location of lines and images so
that they are well-aligned with the pixels, and the issue seems to be
related with that behavior.In my case, using interpolation="none" worked out okay. So give it a try.
Regards,
-JJ
Weird !
Nicolas
On Oct 29, 2012, at 15:40 , jules hummon wrote:
Nicolas
I get that too, (with your script and various things in my work).
But if you zoom in, the lines are in the right place. Is it
some kind of screen aliasing?Jules
------------------------------------------------------------------------------
The Windows 8 Center - In partnership with Sourceforge
Your idea - your app - 30 days.
Get started!
http://windows8center.sourceforge.net/
what-html-developers-need-to-know-about-coding-windows-8-metro-style-apps/
_______________________________________________
Matplotlib-devel mailing list
[email protected]
matplotlib-devel List Signup and Options------------------------------------------------------------------------------
The Windows 8 Center - In partnership with Sourceforge
Your idea - your app - 30 days.
Get started!
http://windows8center.sourceforge.net/
what-html-developers-need-to-know-about-coding-windows-8-metro-style-apps/
_______________________________________________
Matplotlib-devel mailing list
[email protected]
matplotlib-devel List Signup and Options------------------------------------------------------------------------------
Everyone hates slow websites. So do we.
Make your web apps faster with AppDynamics
Download AppDynamics Lite for free today:
http://p.sf.net/sfu/appdyn_sfd2d_oct
_______________________________________________
Matplotlib-devel mailing list
[email protected]
matplotlib-devel List Signup and Options
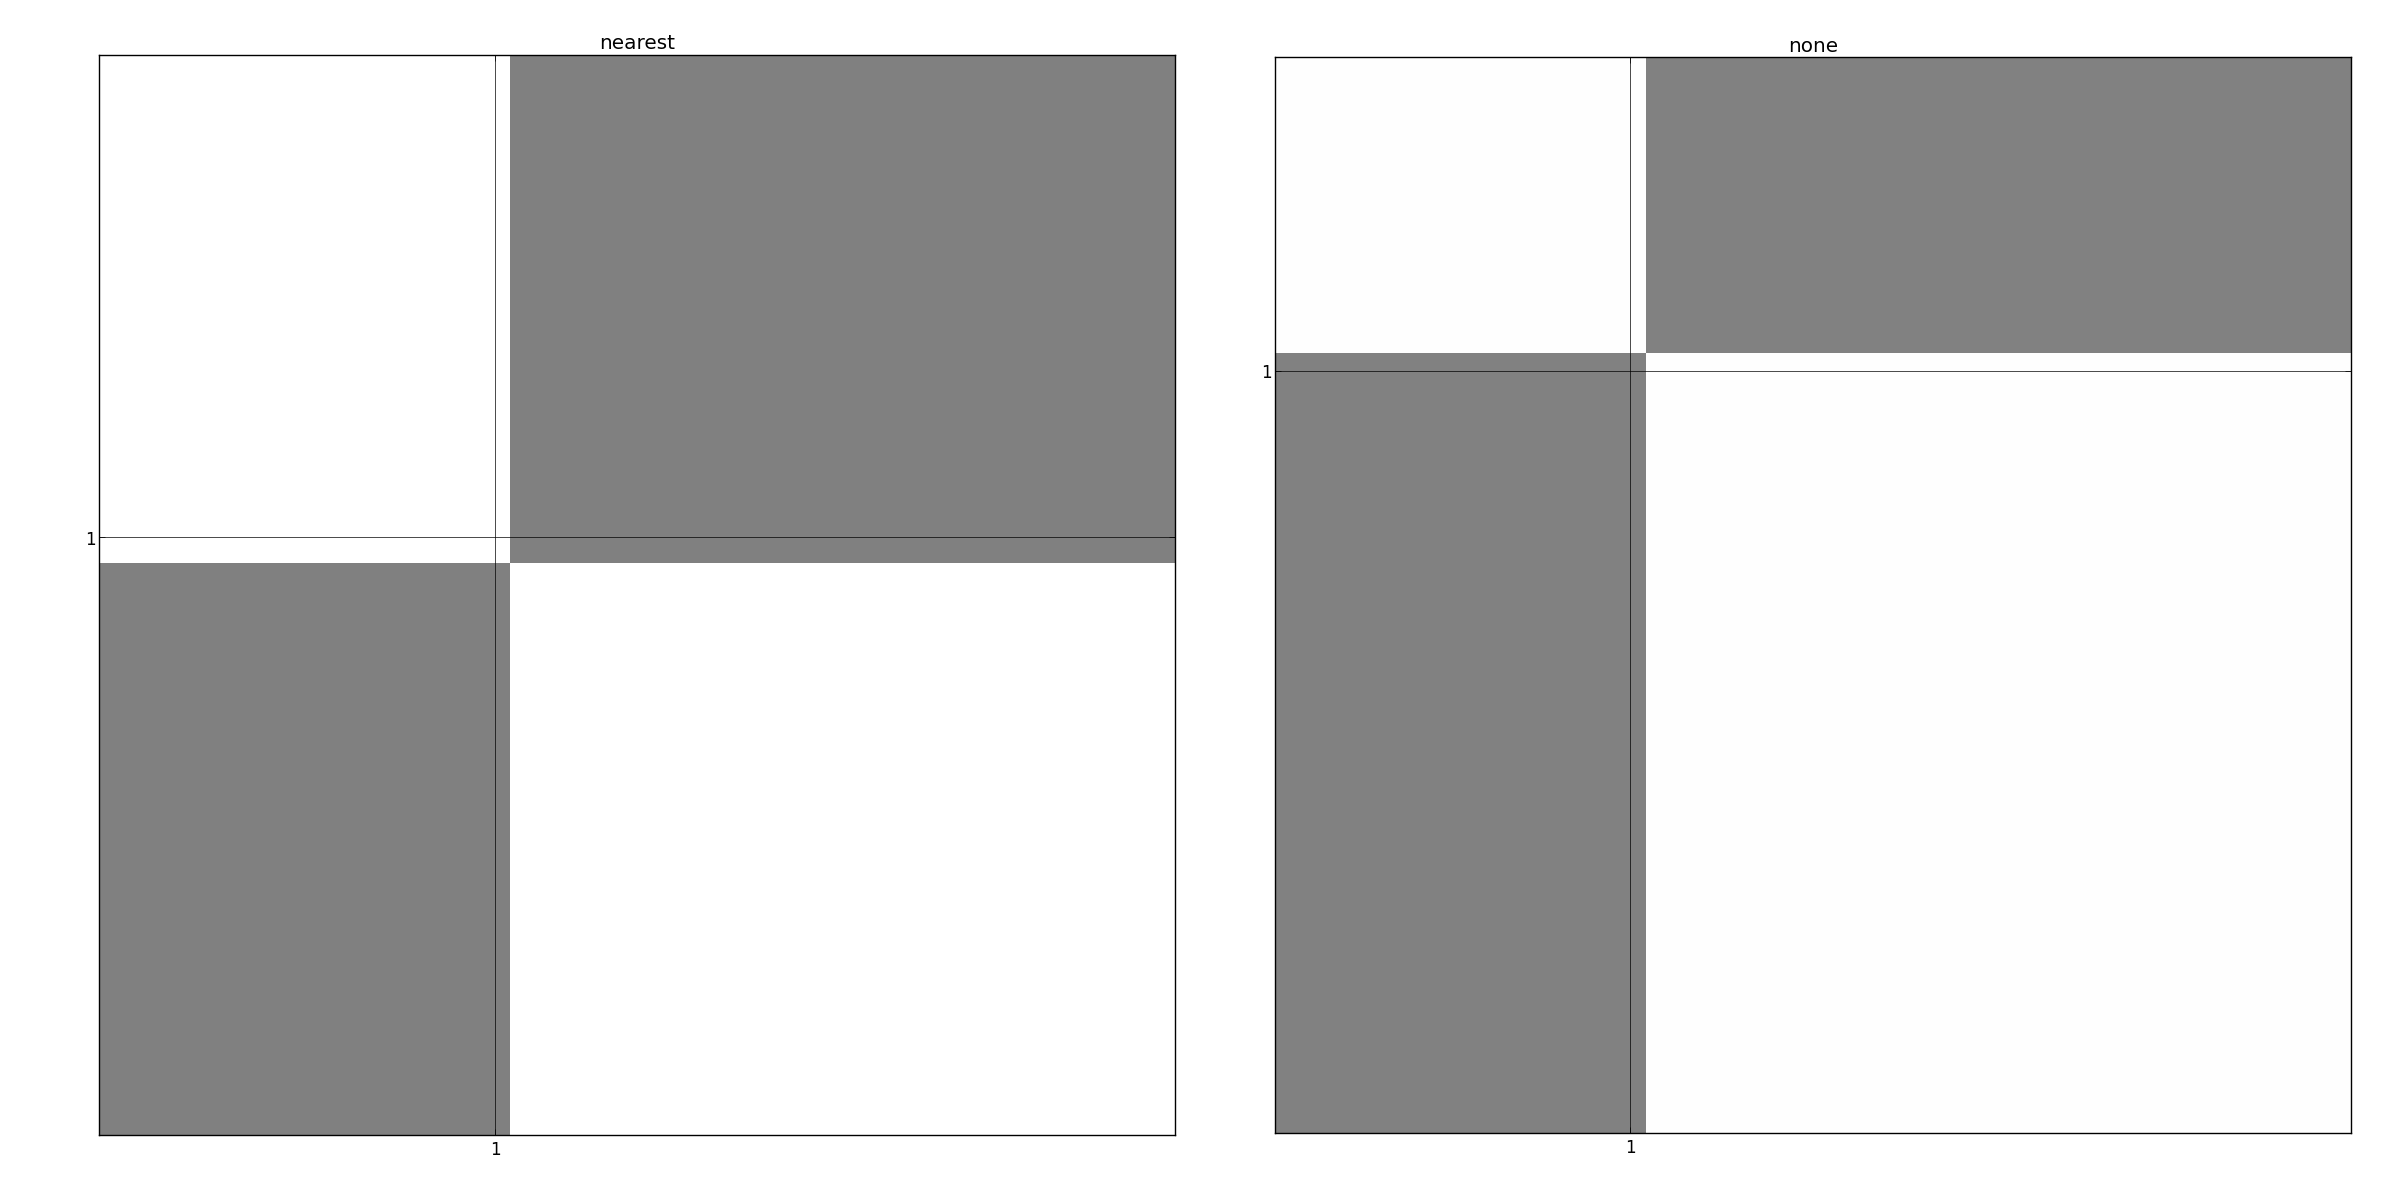
Thanks for making this so easy to reproduce. It is so much easier when there is a small, self contained, correct example!
Initially I was thinking that the problem was some kind of snapping issue with the ticks, but it turns out, if you change the interpolation scheme to “none”, you get perfect alignment:
import numpy as np
import matplotlib.pyplot as plt
n = 16
fig = plt.figure(figsize=(10,10))
Z = np.zeros((n, n))
Z[::2, ::2] = 1
Z[1::2, 1::2] = 1
interp = ‘nearest’
interp = ‘none’
plt.imshow(Z, interpolation=interp,
cmap=‘gray’, extent=[0, n, 0, n],
alpha=0.25)
plt.xticks(np.arange(n))
plt.yticks(np.arange(n))
plt.grid(ls=‘solid’)
plt.show()
I haven’t considered where to go from this point, but I wanted to let you know about this option.
Thanks,
Phil
On 30 October 2012 07:10, Nicolas Rougier <Nicolas.Rougier@…922…> wrote:
Sorry, I was too fast in my reply.
When I save the figure, the png output is ok while the pdf is displaying some kind of interpolation with the image.
import numpy as np
import matplotlib
matplotlib.use(‘Agg’)
import matplotlib.pyplot as pltn = 16
fig = plt.figure(figsize=(6,6))
Z = np.array(([0,1](n//2) + [1,0](n//2))*(n//2)).reshape(n,n)
plt.imshow(Z, interpolation=‘none’, cmap=plt.cm.gray, extent=[0,n,0,n], alpha=.25)
plt.xticks(np.arange(0,n), )plt.yticks(np.arange(0,n), )
plt.grid(ls=‘solid’)
plt.savefig(‘pylab-grid.png’)
plt.savefig(‘pylab-grid.pdf’)
plt.show()
Just for the record, “Skim”, “Preview” and “Adobe Reader” on OSX do not give the same output on the saved pdf.
“Adobe Reader” displays the expected result (same as saved png) while “Preview” and “Skim” are apparently trying to make some (bad) interpolation of the checkboard image.
Nicolas
On Oct 30, 2012, at 7:52 , Nicolas Rougier wrote:
You’re right. Using ‘none’ interpolation seems to solve the problem. Good to know !
One last question, why is the ‘none’ interpolation restricted to Agg/PS/pdf ?
Nicolas
On Oct 30, 2012, at 6:53 , Jae-Joon Lee wrote:
On Tue, Oct 30, 2012 at 12:25 AM, Nicolas Rougier > > >> <Nicolas.Rougier@…55…922…> wrote:
Thanks for testing.
If I zoom at any line cross, the lines are definitely at the wrong place for me.
As jules hummon commented, I see lines in right places when I zoom in.
As for screen aliasing I’m not sure since both the png and pdf seems to be wrong in my case.
It still can be some aliasing-related issue. Note that with
interpolation=“nearest”, the images are rasterized with given dpi even
if you save the figure as pdf.
The agg backend tries to adjust the location of lines and images so
that they are well-aligned with the pixels, and the issue seems to be
related with that behavior.
In my case, using interpolation=“none” worked out okay. So give it a try.
Regards,
-JJ
Weird !
Nicolas
On Oct 29, 2012, at 15:40 , jules hummon wrote:
Nicolas
I get that too, (with your script and various things in my work).
But if you zoom in, the lines are in the right place. Is it
some kind of screen aliasing?
Jules
The Windows 8 Center - In partnership with Sourceforge
Your idea - your app - 30 days.
Get started!
what-html-developers-need-to-know-about-coding-windows-8-metro-style-apps/
Matplotlib-devel mailing list
https://lists.sourceforge.net/lists/listinfo/matplotlib-devel
The Windows 8 Center - In partnership with Sourceforge
Your idea - your app - 30 days.
Get started!
what-html-developers-need-to-know-about-coding-windows-8-metro-style-apps/
Matplotlib-devel mailing list
https://lists.sourceforge.net/lists/listinfo/matplotlib-devel
Everyone hates slow websites. So do we.
Make your web apps faster with AppDynamics
Download AppDynamics Lite for free today:
Matplotlib-devel mailing list
https://lists.sourceforge.net/lists/listinfo/matplotlib-devel
Everyone hates slow websites. So do we.
Make your web apps faster with AppDynamics
Download AppDynamics Lite for free today:
http://p.sf.net/sfu/appdyn_sfd2d_oct
Matplotlib-devel mailing list
https://lists.sourceforge.net/lists/listinfo/matplotlib-devel
In reply to message from Nicolas Rougier, dated Tuesday 30 of October 2012,
on subject “Re: [matplotlib-devel] Misalignment imshow vs. grid lines”
You’re right. Using ‘none’ interpolation seems to solve the problem. Good
to know !
Unfortunately it does not! It only makes problem less pronounced, but still present. Furthermore pcolor is also affected, similarly to imshow, however, the misalignment is usually no more than one pixel (although in some applications it is still unacceptable).
I guess that the problem is with truncation errors in some calculations…
Here are some test scripts and sample results. Mind that the misalignment depend randomly on zoom factor and the position of the image.
The scripts:
import numpy as np
import matplotlib.pyplot as plt
n = 16
fig = plt.figure(figsize=(10,10))
Z = np.ones((n, n))
Z[::2, ::2] = 2
Z[1::2, 1::2] = 2
def test(interp, sub):
plt.subplot(sub)
plt.imshow(Z, interpolation=interp,
cmap=‘gray’, extent=[0, n, 0, n], vmin=0)
plt.xticks(np.arange(n))
plt.yticks(np.arange(n))
plt.grid(ls=‘solid’)
plt.title(interp)
test(‘nearest’, 121)
test(‘none’, 122)
plt.show()
import numpy as np
import matplotlib.pyplot as plt
n = 16
fig = plt.figure(figsize=(10,10))
Z = np.ones((n, n))
Z[::2, ::2] = 2
Z[1::2, 1::2] = 2
plt.pcolor(np.arange(n+1), np.arange(n+1), Z,
cmap=‘gray’, vmin=0)
plt.xticks(np.arange(n))
plt.yticks(np.arange(n))
plt.grid(ls=‘solid’)
plt.show()
The results (some manual zooming) are attached and also available here:
Yep, I can confirm this but the story is a bit different on my side since the .png is wrong but not the .pdf (only ok with Acrobat Reader though):
import numpy as np
import matplotlib
matplotlib.use('Agg')
import matplotlib.pyplot as plt
n = 16
fig = plt.figure(figsize=(6,6))
Z = np.zeros((n,n))
Z[::2,::2] = Z[1::2,1::2] = 1
plt.imshow(Z, interpolation='none', cmap=plt.cm.gray, extent=[0,n,0,n], alpha=0.25)
plt.xticks(np.arange(0,n), ), plt.yticks(np.arange(0,n), )
plt.grid(ls='solid')
delta = 0.01
plt.xlim(1-delta,1+delta), plt.ylim(1-delta,1+delta)
plt.savefig('pylab-grid.png')
plt.savefig('pylab-grid.pdf')
Nicolas
On Oct 30, 2012, at 10:59 , Maciek Dems wrote:
In reply to message from Nicolas Rougier, dated Tuesday 30 of October 2012,
on subject "Re: [matplotlib-devel] Misalignment imshow vs. grid lines"
> You're right. Using 'none' interpolation seems to solve the problem. Good
> to know !Unfortunately it does not! It only makes problem less pronounced, but still present. Furthermore pcolor is also affected, similarly to imshow, however, the misalignment is usually no more than one pixel (although in some applications it is still unacceptable).
I guess that the problem is with truncation errors in some calculations...
Here are some test scripts and sample results. Mind that the misalignment depend randomly on zoom factor and the position of the image.
The scripts:
# test_imshow.py
# --------------
import numpy as np
import matplotlib.pyplot as pltn = 16
fig = plt.figure(figsize=(10,10))Z = np.ones((n, n))
Z[::2, ::2] = 2
Z[1::2, 1::2] = 2def test(interp, sub):
plt.subplot(sub)
plt.imshow(Z, interpolation=interp,
cmap='gray', extent=[0, n, 0, n], vmin=0)plt.xticks(np.arange(n))
plt.yticks(np.arange(n))
plt.grid(ls='solid')
plt.title(interp)test('nearest', 121)
test('none', 122)plt.show()
# test_pcolor.py
# --------------
import numpy as np
import matplotlib.pyplot as pltn = 16
fig = plt.figure(figsize=(10,10))Z = np.ones((n, n))
Z[::2, ::2] = 2
Z[1::2, 1::2] = 2plt.pcolor(np.arange(n+1), np.arange(n+1), Z,
cmap='gray', vmin=0)plt.xticks(np.arange(n))
plt.yticks(np.arange(n))
plt.grid(ls='solid')plt.show()
The results (some manual zooming) are attached and also available here:
http://dems.art.pl/files/imshow.png
http://dems.art.pl/files/pcolor.png--
Maciek Dems http://dems.art.pl/en
<pcolor.png><imshow.png>------------------------------------------------------------------------------
Everyone hates slow websites. So do we.
Make your web apps faster with AppDynamics
Download AppDynamics Lite for free today:
http://p.sf.net/sfu/appdyn_sfd2d_oct_______________________________________________
Matplotlib-devel mailing list
[email protected]
matplotlib-devel List Signup and Options