memory leaks

In 2007, two different major memory leaks have been identified:

1) Eric Pellegrini showed that a loop over figure(); close() leaks. I have verified that this occurs with any interactive backend, but not with non-interactive backends. This may be the same problem that was reported in other messages, such as one by Dylan Passmore in January.

2) There is a recent thread "Re: Memory leak in basemap or matplotlib" showing that even with a non-interactive backend, a seemingly-pointless call to cla() is needed to prevent a leak.

I would like to suggest that we try harder to solve these problems ASAP. This kind of malfunctioning at the core of mpl worries me.

I have spent quite a bit of time trying to figure out (1), and I have tracked it down to the NavigationToolbar2. Eliminate the toolbar by putting None in the rc slot, and the memory leak vanishes. It looks to me like some explicit call to a destroy method may be needed to dismantle the toolbar when a figure is closed and/or deleted. I suspect that each gui toolkit is keeping references to components, and the toolbar is not getting the word when the window is destroyed. gc.garbage verifies that the toolbar components are what get left behind.

So, I hope a gui toolkit backend wizard can step forward and say, "Of course, we just need to put a __del__ method here with a call to destroy()", or something like that.

I have spent much less time on (2), and made no progress.

We are relying very heavily on the gc--mpl has cyclic references all over the place. Is anyone sure that we don't need explicit gc support in any of the extension code? Can *everything* in the extension code be handled correctly with reference counting? Is this independent of how things defined in extension code are used at the python level?

It is not clear to me that gc debugging methods even allow one to see problems in extension code that do not have some degree of gc support. The standard documentation of the gc module and the gc C API is minimal.

Eric
I can add a couple of things to item (1) below. First, the problem occurs only with toolbar2, not with classic or None. Second, a script that illustrates it is attached.

Eric

Eric Firing wrote:

mem_minimal.py (1.57 KB)

···

In 2007, two different major memory leaks have been identified:

1) Eric Pellegrini showed that a loop over figure(); close() leaks. I have verified that this occurs with any interactive backend, but not with non-interactive backends. This may be the same problem that was reported in other messages, such as one by Dylan Passmore in January.

2) There is a recent thread "Re: Memory leak in basemap or matplotlib" showing that even with a non-interactive backend, a seemingly-pointless call to cla() is needed to prevent a leak.

I would like to suggest that we try harder to solve these problems ASAP. This kind of malfunctioning at the core of mpl worries me.

I have spent quite a bit of time trying to figure out (1), and I have tracked it down to the NavigationToolbar2. Eliminate the toolbar by putting None in the rc slot, and the memory leak vanishes. It looks to me like some explicit call to a destroy method may be needed to dismantle the toolbar when a figure is closed and/or deleted. I suspect that each gui toolkit is keeping references to components, and the toolbar is not getting the word when the window is destroyed. gc.garbage verifies that the toolbar components are what get left behind.

So, I hope a gui toolkit backend wizard can step forward and say, "Of course, we just need to put a __del__ method here with a call to destroy()", or something like that.

I have spent much less time on (2), and made no progress.

We are relying very heavily on the gc--mpl has cyclic references all over the place. Is anyone sure that we don't need explicit gc support in any of the extension code? Can *everything* in the extension code be handled correctly with reference counting? Is this independent of how things defined in extension code are used at the python level?

It is not clear to me that gc debugging methods even allow one to see problems in extension code that do not have some degree of gc support. The standard documentation of the gc module and the gc C API is minimal.

Eric

-------------------------------------------------------------------------
Take Surveys. Earn Cash. Influence the Future of IT
Join SourceForge.net's Techsay panel and you'll get the chance to share your
opinions on IT & business topics through brief surveys-and earn cash
http://www.techsay.com/default.php?page=join.php&p=sourceforge&CID=DEVDEV
_______________________________________________
Matplotlib-devel mailing list
Matplotlib-devel@lists.sourceforge.net
matplotlib-devel List Signup and Options

I can add a couple of things to item (1) below. First, the problem
occurs only with toolbar2, not with classic or None. Second, a script
that illustrates it is attached.

I defintely agree that this is important -- and it is a big help to
have a script and the info that you narrowed the problem down to the
presence of the toolbar. report_memory is platform dependent since ps
is. I added a report_memory function to cbook so we could have some
common functionality to rely on. So far it checks for linux or sunos5
and we should add to this and fix it up as necessary. I also stripped
the script down to the bare essentials (the memory report) and added
it to unit/memleak_gui.py so others can use it for testing.

It turns out if you add a savefig call, TkAgg is terribly (1MB per
figure) and I can reproduce the smaller toolbar induced leak on my
platform with TkAgg and GTKAgg. I tried adding some code to
figure.clf to help, but it didn't. I also spent some time trying to
figure out what was going wrong with TkAgg but unfortunately did not
succeed. I don't know anything about Tk, really. One interesting
thing: the enormous filesave leak in TkAgg also only occurs if the
toolbar is present. w/o the toolbar, neither gtkagg nor tkagg leak w/
or w/o the filesave. With the toolbar, both leak a 20-80k w/o the
file save.

Developers: if you know something about a particular GUI, try this
script with -dYourGUIBackend and see if you can isolate the problem!

JDH

# in svn as unit/memleak_gui.py

#!/usr/bin/env python
'''
This illustrates a leak that occurs with any interactive backend.
Run with

> python memleak_gui.py -dGTKAgg # or TkAgg, etc..

You may need to edit cbook.report_memory to support your platform

'''
import os, sys, time
import gc
import matplotlib

#matplotlib.use('TkAgg') # or TkAgg or WxAgg or QtAgg or Gtk
matplotlib.rcParams['toolbar'] = 'toolbar2' # None, classic, toolbar2
#matplotlib.rcParams['toolbar'] = None # None, classic, toolbar2

import pylab
from matplotlib import _pylab_helpers as ph
import matplotlib.cbook as cbook

indStart, indEnd = 30, 50
for i in range(indEnd):

    fig = pylab.figure()
    fig.savefig('test')
    fig.clf()
    pylab.close(fig)
    val = cbook.report_memory(i)
    print i, val
    gc.collect()
    if i==indStart: start = val # wait a few cycles for memory usage
to stabilize

gc.collect()
print
print 'uncollectable list:', gc.garbage
print
end = val
if i > indStart:
    print 'Average memory consumed per loop: %1.4fk bytes\n' %
((end-start)/float(indEnd-indStart))

···

On 3/27/07, Eric Firing <efiring@...229...> wrote:

John Hunter wrote:


I can add a couple of things to item (1) below. First, the problem
occurs only with toolbar2, not with classic or None. Second, a script
that illustrates it is attached.
    
I defintely agree that this is important -- and it is a big help to
have a script and the info that you narrowed the problem down to the
presence of the toolbar. report_memory is platform dependent since ps
is. I added a report_memory function to cbook so we could have some
common functionality to rely on. So far it checks for linux or sunos5
and we should add to this and fix it up as necessary. I also stripped
the script down to the bare essentials (the memory report) and added
it to unit/memleak_gui.py so others can use it for testing.

It turns out if you add a savefig call, TkAgg is terribly (1MB per
figure) and I can reproduce the smaller toolbar induced leak on my
platform with TkAgg and GTKAgg. I tried adding some code to
figure.clf to help, but it didn't. I also spent some time trying to
figure out what was going wrong with TkAgg but unfortunately did not
succeed. I don't know anything about Tk, really. One interesting
thing: the enormous filesave leak in TkAgg also only occurs if the
toolbar is present. w/o the toolbar, neither gtkagg nor tkagg leak w/
or w/o the filesave. With the toolbar, both leak a 20-80k w/o the
file save.

Developers: if you know something about a particular GUI, try this
script with -dYourGUIBackend and see if you can isolate the problem!

JDH

# in svn as unit/memleak_gui.py

#!/usr/bin/env python
'''
This illustrates a leak that occurs with any interactive backend.
Run with

> python memleak_gui.py -dGTKAgg # or TkAgg, etc..

You may need to edit cbook.report_memory to support your platform

'''
import os, sys, time
import gc
import matplotlib

#matplotlib.use('TkAgg') # or TkAgg or WxAgg or QtAgg or Gtk
matplotlib.rcParams['toolbar'] = 'toolbar2' # None, classic, toolbar2
#matplotlib.rcParams['toolbar'] = None # None, classic, toolbar2

import pylab
from matplotlib import _pylab_helpers as ph
import matplotlib.cbook as cbook

indStart, indEnd = 30, 50
for i in range(indEnd):

    fig = pylab.figure()
    fig.savefig('test')
    fig.clf()
    pylab.close(fig)
    val = cbook.report_memory(i)
    print i, val
    gc.collect()
    if i==indStart: start = val # wait a few cycles for memory usage
to stabilize

gc.collect()
print
print 'uncollectable list:', gc.garbage
print
end = val
if i > indStart:
    print 'Average memory consumed per loop: %1.4fk bytes\n' %
((end-start)/float(indEnd-indStart))
  
John: I just added macos x support in the report_memory function. Regarding Eric's memory leak #2 (which occurs even for non-gui backends), here's a simple script to trigger it:

import os,matplotlib
matplotlib.use('Agg')
from matplotlib.figure import Figure
from matplotlib.cbook import report_memory

def plot():
    fig = Figure()
    i = 0
    while True:
        print report_memory(i)
        fig.clf()
        ax = fig.add_axes([0.1,0.1,0.7,0.7])
        ax.plot([1,2,3])
        i += 1

if __name__ == '__main__': plot()

-Jeff

···

On 3/27/07, Eric Firing <efiring@...229...> wrote:

--
Jeffrey S. Whitaker Phone : (303)497-6313
Meteorologist FAX : (303)497-6449
NOAA/OAR/PSD R/PSD1 Email : Jeffrey.S.Whitaker@...236...
325 Broadway Office : Skaggs Research Cntr 1D-124
Boulder, CO, USA 80303-3328 Web : Jeffrey S. Whitaker: NOAA Physical Sciences Laboratory

Thanks Jeff, could you add this to the unit dir as well?

JDH

···

On 3/28/07, Jeff Whitaker <jswhit@...196...> wrote:

John: I just added macos x support in the report_memory function.
Regarding Eric's memory leak #2 (which occurs even for non-gui
backends), here's a simple script to trigger it:

John Hunter wrote:

···

On 3/28/07, Jeff Whitaker <jswhit@...196...> wrote:

John: I just added macos x support in the report_memory function.
Regarding Eric's memory leak #2 (which occurs even for non-gui
backends), here's a simple script to trigger it:

Thanks Jeff, could you add this to the unit dir as well?

JDH

Done - added as memleak_nongui.py

-Jeff

--
Jeffrey S. Whitaker Phone : (303)497-6313
Meteorologist FAX : (303)497-6449
NOAA/OAR/PSD R/PSD1 Email : Jeffrey.S.Whitaker@...236...
325 Broadway Office : Skaggs Research Cntr 1D-124
Boulder, CO, USA 80303-3328 Web : Jeffrey S. Whitaker: NOAA Physical Sciences Laboratory

import os,matplotlib
matplotlib.use('Agg')
from matplotlib.figure import Figure
from matplotlib.cbook import report_memory

def plot():
    fig = Figure()
    i = 0
    while True:
        print report_memory(i)
        fig.clf()
        ax = fig.add_axes([0.1,0.1,0.7,0.7])
        ax.plot([1,2,3])
        i += 1

if __name__ == '__main__': plot()

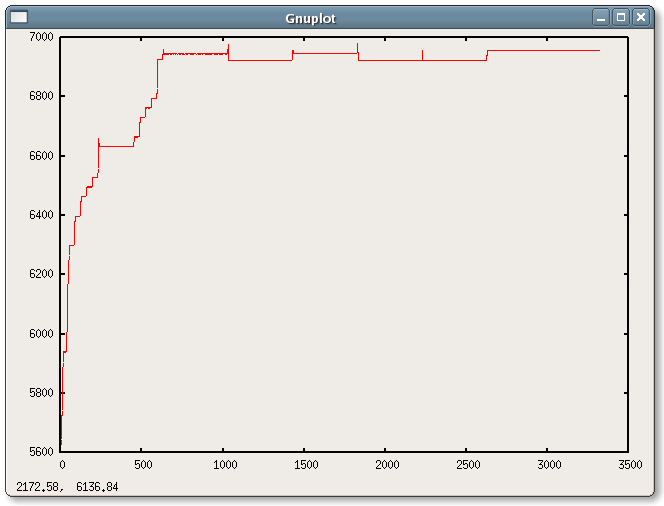
I have matplotlib-0.90.0 installed, and this script doesn't leak for me. It grows a bit as shown in the graph, then stabilizes. I'm on FC4 with Python 2.4.3.

···

--
Tom Holroyd, Ph.D.
We experience the world not as it is, but as we expect it to be.

You used gnuplot to plot MPL memory use?

for shame, for shame!

:wink:

-Chris

Tom Holroyd (NIH/NIMH) [E] wrote:

···

as shown in the graph, then stabilizes.

--
Christopher Barker, Ph.D.
Oceanographer

Emergency Response Division
NOAA/NOS/OR&R (206) 526-6959 voice
7600 Sand Point Way NE (206) 526-6329 fax
Seattle, WA 98115 (206) 526-6317 main reception

Chris.Barker@...236...

Tom Holroyd (NIH/NIMH) [E] wrote:

import os,matplotlib
matplotlib.use('Agg')
from matplotlib.figure import Figure
from matplotlib.cbook import report_memory

def plot():
    fig = Figure()
    i = 0
    while True:
        print report_memory(i)
        fig.clf()
        ax = fig.add_axes([0.1,0.1,0.7,0.7])
        ax.plot([1,2,3])
        i += 1

if __name__ == '__main__': plot()

I have matplotlib-0.90.0 installed, and this script doesn't leak for me. It grows a bit as shown in the graph, then stabilizes. I'm on FC4 with Python 2.4.3.

------------------------------------------------------------------------

Right - here too (on macos x), it levels off about about 15 times the initial memory usage. I just didn't run it long enough to notice that before.

-Jeff

···

--
Jeffrey S. Whitaker Phone : (303)497-6313
Meteorologist FAX : (303)497-6449
NOAA/OAR/PSD R/PSD1 Email : Jeffrey.S.Whitaker@...236...
325 Broadway Office : Skaggs Research Cntr 1D-124
Boulder, CO, USA 80303-3328 Web : Jeffrey S. Whitaker: NOAA Physical Sciences Laboratory

In fact, the following loop leaks:

for i in range(indEnd):
    fig = pylab.figure()

about 2k per on my box _even_ with toolbar set to None.
With it set to toolbar2, it is very noticably slower, and leaks 120k per.

···

--
Tom Holroyd, Ph.D.
We experience the world not as it is, but as we expect it to be.

More info on the memory leaks. It has to do with GtkToolbar.insert(). For example, in the function _init_toolbar2_4() in backend_gtk.py, commenting out any of the self.insert() calls will change how much it leaks. Comment them all out, plus the self.fileselect assignment (which is very slow, by the way, and accounts for more leaks than other places) and it'll leak minimally.

Does that mean this is a bug in gtk?

···

--
Tom Holroyd, Ph.D.
We experience the world not as it is, but as we expect it to be.

Tom Holroyd (NIH/NIMH) [E] wrote:

More info on the memory leaks. It has to do with GtkToolbar.insert(). For example, in the function _init_toolbar2_4() in backend_gtk.py, commenting out any of the self.insert() calls will change how much it leaks. Comment them all out, plus the self.fileselect assignment (which is very slow, by the way, and accounts for more leaks than other places) and it'll leak minimally.

Does that mean this is a bug in gtk?

I don't know. I have been experimenting with a simple pure pygtk demo (no mpl components). I was about to conclude that it leaked whenever the toplevel show() method was used, but I just now did another test that suggests this is not the case if the mainloop in started and the window is killed each time--which would be the normal mode of operation, but is tedious to test for large numbers of iterations. (It should be possible to simulate it instead.) I have not tried enough of such loops to be sure yet, but overall, I am suspecting that the problem in mpl is not inevitable but has to do with the way the gtk things are called and referenced. I think we have a similar problem with all interactive backends (the only one I didn't test is Qt4Agg) which also makes me suspect we are violating some gui rule, rather than that gtk, qt3, wx, and tk all have leaks.

I added a MemoryMonitor class to cbook.py to make this testing a little easier. No docstrings yet, but it will be obvious what it does.

Eric