Hi all,
What is the state-of-the-art of making matrix structure plots of sparse
matrices with matplotlib ?
Nils
Hi all,
What is the state-of-the-art of making matrix structure plots of sparse
matrices with matplotlib ?
Nils
Hi Nils,
You've got the 'spy' function, just like in MATLAB. Works a treat. For example, see under ' Viewing an incidence matrix' on the page:
https://pse.cheme.cmu.edu/wiki/view/Ascend/ScreenShots
In fact this example uses some tricks to perform colouring of the plot. All is explained in the matplotlib wiki.
Cheers
JP
Nils Wagner wrote:
Hi all,
What is the state-of-the-art of making matrix structure plots of sparse
matrices with matplotlib ?
Nils
--
John Pye
Department of Mechanical and Manufacturing Engineering
University of New South Wales, Sydney, Australia
Nils Wagner wrote:
Hi all,
What is the state-of-the-art of making matrix structure plots of sparse
matrices with matplotlib ?
Nils
I use this simple code:
row, col are arrays of indices of nonzero matrix entries nItem long, nRow, nCol is the matrix shape
plot( col + 0.5, row + 0.5, linestyle = 'None', marker = ',', markersize = 0.5, markeredgewidth = 0.1 )
axis( [-0.5, nRow+0.5, -0.5, nCol+0.5] )
axis( 'equal' )
xlabel( '%d x %d: %d nnz, %.2f%% fill' % (nRow, nCol, nItem, 100. * nItem / float( nRow * nCol )) )
In SciPy, to get row, col, convert your matrix to the 'COO' format via m = m.tocoo(), then m.row, m.col are your indices.
r.
John Pye wrote:
Hi Nils,
You've got the 'spy' function, just like in MATLAB. Works a treat. For
example, see under ' Viewing an incidence matrix' on the page:
https://pse.cheme.cmu.edu/wiki/view/Ascend/ScreenShotsIn fact this example uses some tricks to perform colouring of the
plot. All is explained in the matplotlib wiki.Cheers
JPNils Wagner wrote:
Hi all,
What is the state-of-the-art of making matrix structure plots of sparse
matrices with matplotlib ?Nils
Thank you for your feedback.
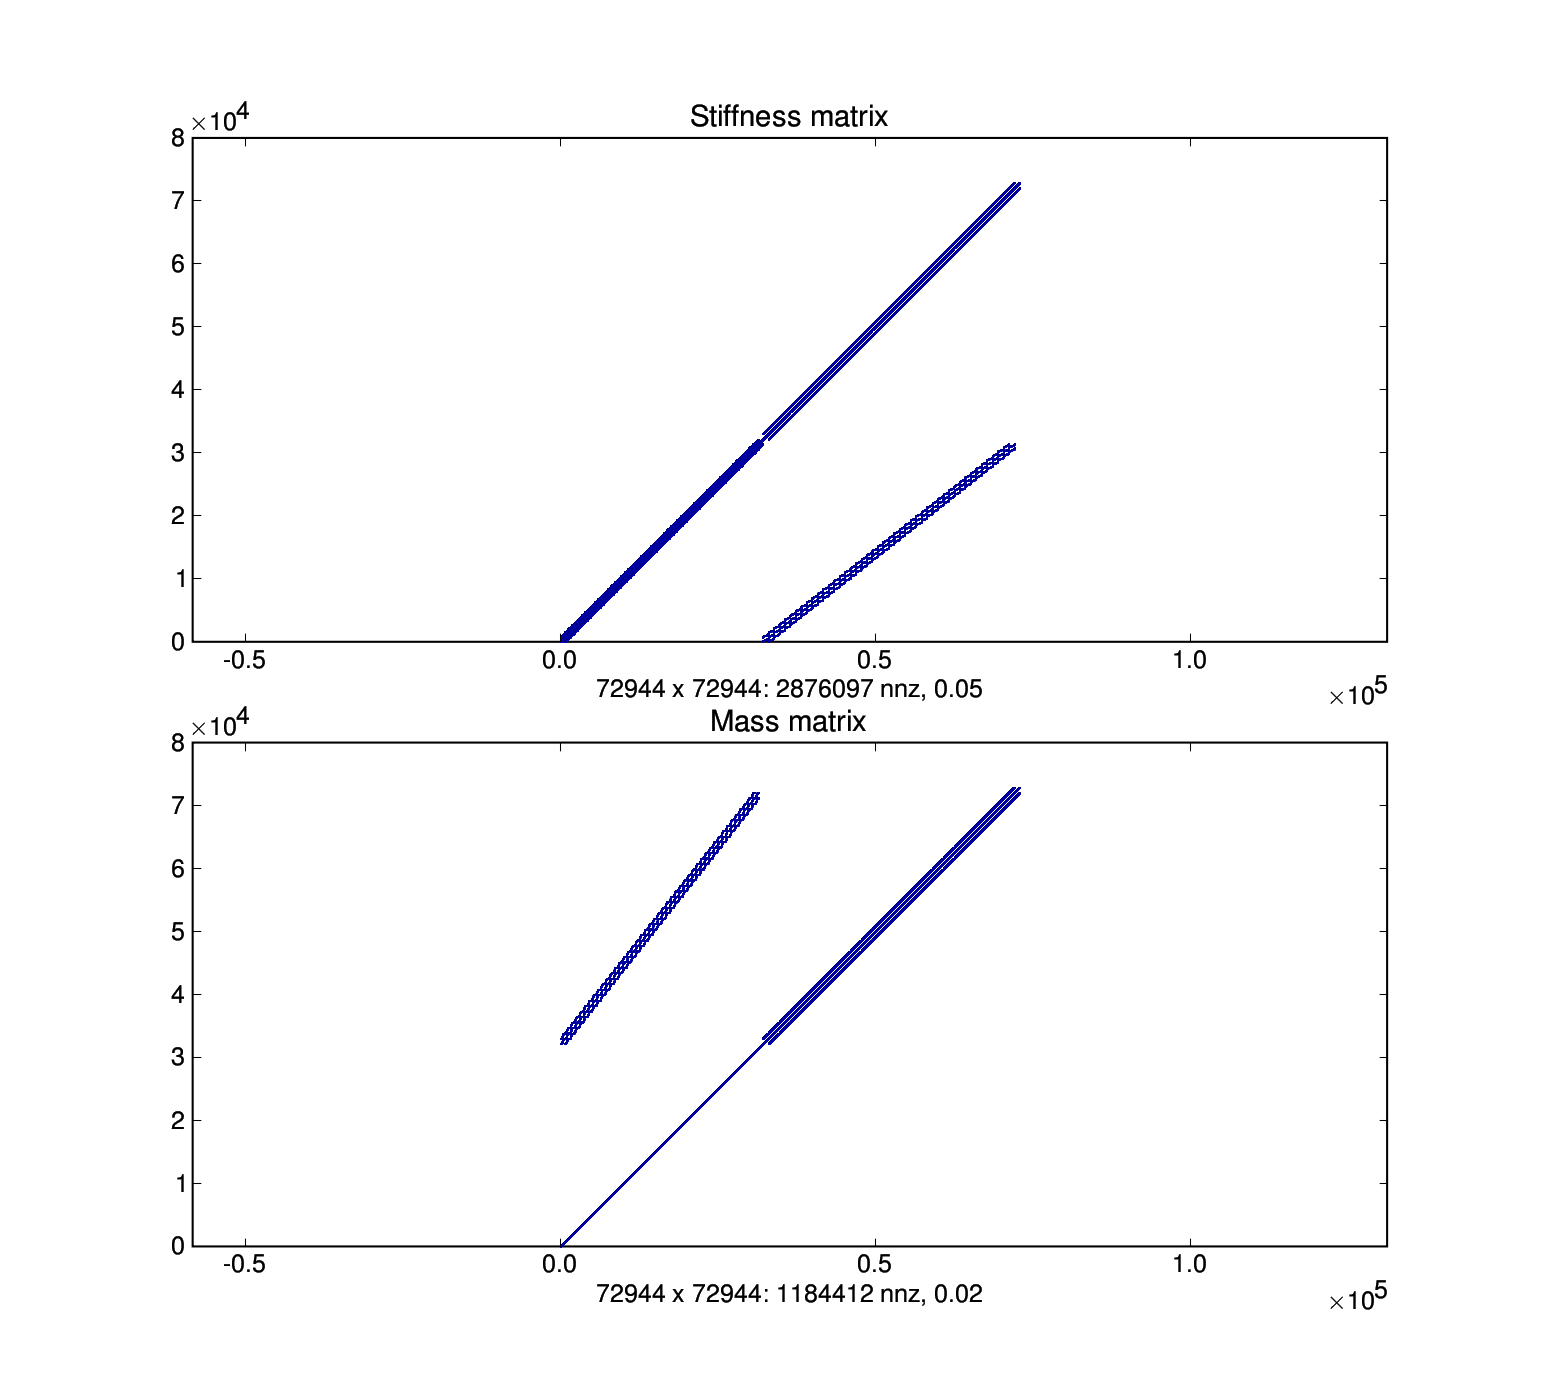
Finally I have used Robert Cimrman's code to generate a matrix structure
plot (structure.png).
However, the entries should lie on the main diagonal instead of the
antidiagonal.
So what is missing in the code below ? How do I change the orientation
of the plots ?
from pylab import show, plot, axis, xlabel, subplot, title
from scipy import *
K = io.mmread('k.mtx')
M = io.mmread('m.mtx')
print 'Reading finished'
rowk = K.row
colk = K.col
nItemk = len(colk)
nRowk, nColk = shape(K)
rowm = M.row
colm = M.col
nItemm = len(colm)
nRowm, nColm = shape(M)
subplot(211)
title('Stiffness matrix')
plot( colk + 0.5, rowk + 0.5, linestyle = 'None', marker = ',',
markersize = 0.5, markeredgewidth = 0.1 )
axis( [-0.5, nRowk+0.5, -0.5, nColk+0.5] )
axis( 'equal' )
xlabel( '%d x %d: %d nnz, %.2f%% fill' % (nRowk, nColk, nItemk, 100. *
nItemk / float( nRowk * nColk )) )
subplot(212)
title('Mass matrix')
plot( colm + 0.5, rowm + 0.5, linestyle = 'None', marker = ',',
markersize = 0.5, markeredgewidth = 0.1 )
axis( [-0.5, nRowm+0.5, -0.5, nColm+0.5] )
axis( 'equal' )
xlabel( '%d x %d: %d nnz, %.2f%% fill' % (nRowm, nColk, nItemm, 100. *
nItemm / float( nRowm * nColm )) )
show()
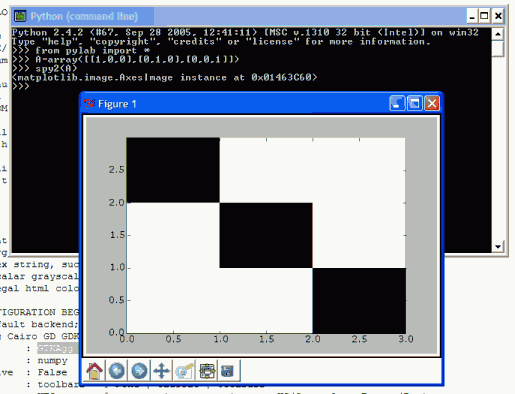
Hi Nils,
I think you’re missing the simplicity of pylab if you don’t use the
‘spy’ or ‘spy2’ approach. Here is what I had to do. (I needed to
install the suggested ,
changing ‘backend:TkAgg’ and ‘interactive:True’)
Nils Wagner wrote:
http://matplotlib.sourceforge.net/matplotlibrc
Thank you for your feedback. Finally I have used Robert Cimrman's code to generate a matrix structure plot (structure.png).
-- John Pye
Department of Mechanical and Manufacturing Engineering
University of New South Wales, Sydney, Australia