Hi Hannah-
Yes, that works!! Thank you! I’ve got one more question –and if I can understand this example, then I think I can make my plot display the lat/lon lines onto the
contour plot. Could you comment on what’s going on with this code with the highlight lines below?
https://scitools.org.uk/cartopy/docs/v0.15/matplotlib/advanced_plotting.html
Then, I should be able to apply it to my plotting problem.
Thanks! Randall
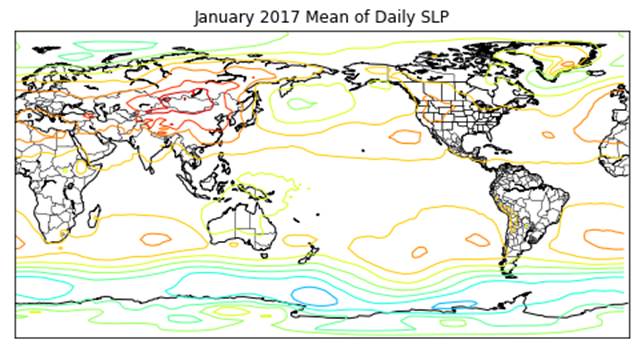
Here is my image and I’m trying to plot the lat/lon lines and the plotting code:
Define an axes object with a projection
ax = plt.axes(projection=ccrs.PlateCarree())
Plot the coastline
ax.coastlines(lw=1)
stdnasq = stdna.squeeze().plot.contourf(levels=12,add_labels=True)
ax.set_xlabel(‘’)
plt.show()
···
import
os
import
matplotlib.pyplot
as
plt
from
netCDF4
import Dataset
as netcdf_dataset
import
numpy
as
np
from
cartopy
import config
import
cartopy.crs
as
ccrs
# get the path of the file. It can be found in the repo data directory.
fname
= os.path.join(config[“repo_data_dir”],
‘netcdf’,
‘HadISST1_SST_update.nc’
)
dataset
= netcdf_dataset(fname)
sst
dataset.variables[‘sst’][0 ,
:, :]
lats
dataset.variables[‘lat’][:]
lons
dataset.variables[‘lon’][:]
ax
plt.axes(projection=ccrs.PlateCarree())
plt. contourf(lons,
lats, sst, 60,
transform=ccrs.PlateCarree())
ax.coastlines()
plt.show()
From: Hannah [email protected]
Sent: Thursday, March 19, 2020 3:38 PM
To: Benson, Randall [email protected]
Cc: Matplotlib-users [email protected]
Subject: Re: EXTERNAL: Re: [Matplotlib-users] Variability Plots Matplotlib NetCDF4 Data
Ok, was able to reproduce when I did stdna.plot.contour() (missed that bit the first time!) and the fix was stdna.squeeze().plot.contour()
On Thu, Mar 19, 2020 at 6:35 PM Hannah [email protected] wrote:
try stdna.squeeze().plot() ?
I tried to make a minimum reproduction & I can’t reproduce the error. Any chance you can share a binder or how you’re getting your data?
This is what I tried:
slp = np.random.random(([1, 73,144]))
stdn = xr.Dataset({‘slp’: ([‘month’, ‘lat’, ‘lon’], slp)})
stdna = stdn.to_array()# must convert the xarray “dataset” to “dataArray”!!!
print(stdna.shape)
stdna = stdna.rename(‘Standardized SLP Anomaly’)
ax = plt.axes(projection=ccrs.PlateCarree())
ax.coastlines(lw=1)
stdna.plot()
On Thu, Mar 19, 2020 at 5:52 PM Benson, Randall [email protected] wrote:
Hi -
I solved it by converting the datasets to dataarrays using this below with my variable a dataArray “stdna”
and calling the “plot” command.
However, when I try to plot this variable using – stdna.plot.contourf() – but I get an error saying
my data must be 2D. The “stnda” variable looks like this –
stdna
Out[181]:
<xarray.DataArray ‘Standardized SLP Anomaly’ (variable: 1, month: 1, lat: 73, lon: 144)>
dask.array<stack, shape=(1, 1, 73, 144), dtype=float32, chunksize=(1, 1, 73, 144), chunktype=numpy.ndarray>
Coordinates:
- lon (lon) float32 0.0 2.5 5.0 7.5 10.0 … 350.0 352.5 355.0 357.5
- lat (lat) float32 90.0 87.5 85.0 82.5 80.0 … -82.5 -85.0 -87.5 -90.0
- variable (variable) <U3 ‘slp’
This works below….
stdna = stdn.to_array()# must convert the xarray “dataset” to “dataArray”!!!
#stdna.rename(‘Standardized SLP Anomaly’)#rename dataarray
stdna = stdna.rename(‘Standardized SLP Anomaly’)#for legend description label
Define an axes object with a projection
ax = plt.axes(projection=ccrs.PlateCarree())
Plot the coastline
ax.coastlines(lw=1)
stdna.plot()
From: Hannah [email protected]
Sent: Thursday, March 19, 2020 1:32 PM
To: Benson, Randall [email protected]
Cc: Matplotlib-users [email protected]
Subject: Re: EXTERNAL: Re: [Matplotlib-users] Variability Plots Matplotlib NetCDF4 Data
Hi,
Sorry for the late reply, been swamped. If you haven’t sorted this out, can you please post at least some of the code that generated this error?
Thanks!
On Tue, Mar 17, 2020 at 1:06 AM Benson, Randall [email protected] wrote:
Hi Hannah –
Are you familiar with this error using xarray to plot gridded netcd4 data?
This is the out from “stdn.var”
<bound method ImplementsDatasetReduce._reduce_method..wrapped_func of <xarray.Dataset>
Dimensions: (lat: 73, lon: 144, month: 1)
Coordinates:
- lon (lon) float32 0.0 2.5 5.0 7.5 10.0 … 350.0 352.5 355.0 357.5
- lat (lat) float32 90.0 87.5 85.0 82.5 80.0 … -82.5 -85.0 -87.5 -90.0
Data variables:
slp (month, lat, lon) float32 dask.array<chunksize=(1, 73, 144), meta=np.ndarray>>
I keep getting this error –
- AttributeError: ‘_Dataset_PlotMethods’ object has no attribute ‘contourf’
Thank you,
Randall
From: Hannah [email protected]
Sent: Wednesday, March 11, 2020 4:28 PM
To: Benson, Randall [email protected]
Cc: Matplotlib-users [email protected]
Subject: EXTERNAL: Re: [Matplotlib-users] Variability Plots Matplotlib NetCDF4 Data
Hi Randall,
I’m not sure what specifically you’re asking for. Are you using xarray (http://xarray.pydata.org/en/stable/ ) ?
If not, it might help in more efficiently computing the anomolies once you read all the files into an xarray:
http://xarray.pydata.org/en/stable/examples/weather-data.html#Calculate-monthly-anomalies
On Wed, Mar 11, 2020, 4:17 PM Benson, Randall [email protected] wrote:
HI-
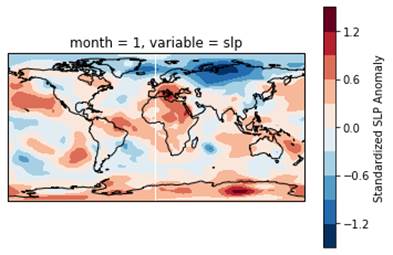
I’m trying to develop monthly standardized anomaly plots of Sea Level Pressure (SLP) using NCEP reanalysis
data in netCDF4 format. I can plot netCDF4 data for a single month in plot form like the example shown below. However, I need to construct average SLP plots for each month given a set of years and use those to plot the standardized anomalies for each month
of the current year. So, I’m looking too for just examples (python code) of creating variability plots using gridded data in Matplotlib. Thank you!
Randall Benson
Randall P. Benson, PhD
Wind Asset Meteorologist, Energy Resource - Onshore
1125 NW Couch Street, Suite 700
Portland, Oregon, USA 97209
Telephone 503-796-7129
Cell 971-227-2477
[email protected]
In the interest of the environment,
please print only if necessary and recycle.
==============================================================
Please consider the environment before printing this email.
If you have received this message in error, please notify the sender and immediately delete this message and any attachment hereto and/or copy hereof, as such message contains confidential information intended solely for the individual or entity to whom it is addressed. The use or disclosure of such information to third parties is prohibited by law and may give rise to civil or criminal liability.
The views presented in this message are solely those of the author(s) and do not necessarily represent the opinion of Avangrid Renewables, LLC. or any company of its group. Neither Avangrid Renewables, LLC. nor any company of its group guarantees the integrity, security or proper receipt of this message. Likewise, neither Avangrid Renewables, LLC. nor any company of its group accepts any liability whatsoever for any possible damages arising from, or in connection with, data interception, software viruses or manipulation by third parties.
==============================================================
Matplotlib-users mailing list
[email protected]
https://mail.python.org/mailman/listinfo/matplotlib-users
==============================================================
Please consider the environment before printing this email.
If you have received this message in error, please notify the sender and immediately delete this message and any attachment hereto and/or copy hereof, as such message contains confidential information intended solely for the individual or entity to whom it is addressed. The use or disclosure of such information to third parties is prohibited by law and may give rise to civil or criminal liability.
The views presented in this message are solely those of the author(s) and do not necessarily represent the opinion of Avangrid Renewables, LLC. or any company of its group. Neither Avangrid Renewables, LLC. nor any company of its group guarantees the integrity, security or proper receipt of this message. Likewise, neither Avangrid Renewables, LLC. nor any company of its group accepts any liability whatsoever for any possible damages arising from, or in connection with, data interception, software viruses or manipulation by third parties.
==============================================================
==============================================================
Please consider the environment before printing this email.
If you have received this message in error, please notify the sender and immediately delete this message and any attachment hereto and/or copy hereof, as such message contains confidential information intended solely for the individual or entity to whom it is addressed. The use or disclosure of such information to third parties is prohibited by law and may give rise to civil or criminal liability.
The views presented in this message are solely those of the author(s) and do not necessarily represent the opinion of Avangrid Renewables, LLC. or any company of its group. Neither Avangrid Renewables, LLC. nor any company of its group guarantees the integrity, security or proper receipt of this message. Likewise, neither Avangrid Renewables, LLC. nor any company of its group accepts any liability whatsoever for any possible damages arising from, or in connection with, data interception, software viruses or manipulation by third parties.
==============================================================