Hi John,
I need to dynamically resize the font depending of the number of panels in a
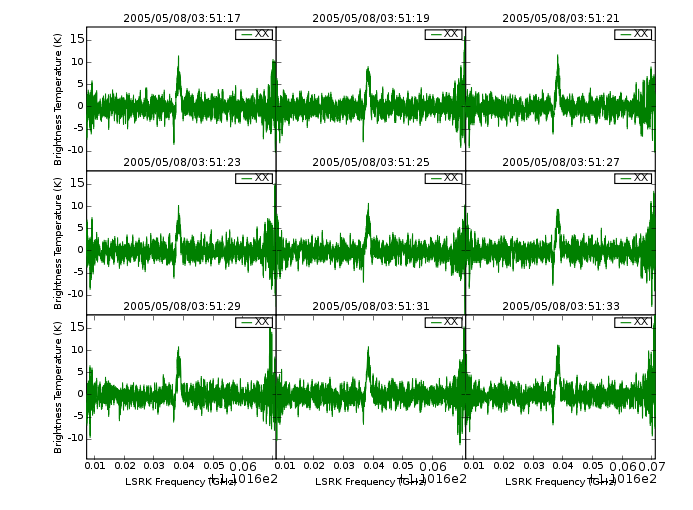
ganged plot. I have attached an example of what I have done so far.
You can see that the GHz base value label isn't scaled. That is why I was
contemplating a Styler similar to the Formatter class(es). Also at the time
of setting the fontsize (after calling figure.add_subplot) the number of
ticks isn't known, so it scales only the default number of tick labels as
can be seen in the example plot.
Sorry if my descriptions sounds a bit convoluted, but the example hopefully
shows my problem.
Cheers
Malte
···
On Tuesday 18 April 2006 21:28, John Hunter wrote:
and ditto for yaxis. Also, if you like to save typing, you can use
the setp functionality to set multiple properties for multiple objects
w/o changing the defaultssetp(ax.get_xticklabels(), fontsize=12, color='red')
JDH