jjj
1
Hi,
I have a problem using ‘symlog’ when the range maximum is below 1e0=1. Perhaps I’m misusing it, possibly the linthresh option.
Example notebook: https://gist.github.com/liangwang0734/fde9a033c3d8788075589e2f9fd87f0c
Sample code:
import numpy as np
import matplotlib as mpl
import matplotlib.pyplot as plt
def test(start):
linthresh = 10**(start+1)
tmp = np.logspace(start, start + 3, 20)
tmp = np.hstack((-tmp[::-1], tmp))
fig, ax = plt.subplots()
ax.plot(tmp, marker=‘o’)
ax.set_yscale(‘symlog’, linthresh=linthresh)
ax1 = ax.twinx()
ax1.plot(tmp, c=‘orange’, ls=‘–’)
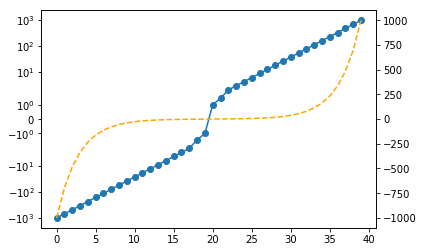
test(0) # OK, linear scale and symlog scale look different
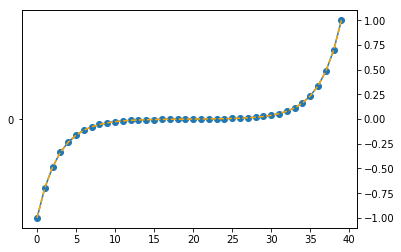
test(-3) # iffy, linear scale and symlog scale look the same
jjj
2
It turns out for yscale, I need to use linthreshy not linthresh. Problem solved.
···
On Tue, Sep 22, 2020 at 11:45 PM Liang Wang <[email protected]> wrote:
Hi,
I have a problem using ‘symlog’ when the range maximum is below 1e0=1. Perhaps I’m misusing it, possibly the linthresh option.
Example notebook: https://gist.github.com/liangwang0734/fde9a033c3d8788075589e2f9fd87f0c
Sample code:
import numpy as np
import matplotlib as mpl
import matplotlib.pyplot as plt
def test(start):
linthresh = 10**(start+1)
tmp = np.logspace(start, start + 3, 20)
tmp = np.hstack((-tmp[::-1], tmp))
fig, ax = plt.subplots()
ax.plot(tmp, marker=‘o’)
ax.set_yscale(‘symlog’, linthresh=linthresh)
ax1 = ax.twinx()
ax1.plot(tmp, c=‘orange’, ls=‘–’)
test(0) # OK, linear scale and symlog scale look different
test(-3) # iffy, linear scale and symlog scale look the same