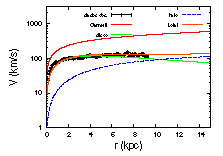
I need the yscale so: 1 - 10 - 100 - 1000 . See my image attached. Can you help me, please.
Thanks,
···
On Mon, Feb 21, 2011 at 1:51 PM, <matplotlib-users-request@…2018…rceforge.net> wrote:
Send Matplotlib-users mailing list submissions to
matplotlib-users@lists.sourceforge.netTo subscribe or unsubscribe via the World Wide Web, visit
[https://lists.sourceforge.net/lists/listinfo/matplotlib-users](https://lists.sourceforge.net/lists/listinfo/matplotlib-users)or, via email, send a message with subject or body ‘help’ to
matplotlib-users-request@lists.sourceforge.netYou can reach the person managing the list at
matplotlib-users-owner@lists.sourceforge.netWhen replying, please edit your Subject line so it is more specific
than “Re: Contents of Matplotlib-users digest…”
Today’s Topics:
Re: xscale and yscale (Benjamin Root)
Re: xscale and yscale (Wal?ria Antunes David)
Message: 1
Date: Mon, 21 Feb 2011 10:32:13 -0600
From: Benjamin Root <ben.root@…83…1304…>
Subject: Re: [Matplotlib-users] xscale and yscale
To: Wal?ria Antunes David <waleriantunes@…287…>
Cc: Matplotlib Users matplotlib-users@lists.sourceforge.net
Message-ID:
<AANLkTikRUojpNGPmjXLW9M_UZMuVrLK9pVenQjDeshxb@...288...>Content-Type: text/plain; charset=“iso-8859-1”
On Mon, Feb 21, 2011 at 10:23 AM, Wal?ria Antunes David < > > waleriantunes@…287…> wrote:
See my code: http://pastebin.com/xtgKteuW
I need that tn the x-axis should have a scale like this: 0 - 2 - 4 - 6 - 8
- 10 - 12 - 14 and in the y-axis a scale: 1 - 10 - 100 -1000 . See my
images, the image correct_graph is correct.
Thanks,
One problem at a time. You are doing an errorbar plot and then creating a
subplot. The subplot axes will not be the same thing as the axes you just
made the errorbar plot on.
See the correction here: http://pastebin.com/aZEJuGs2
Note, this does not address your tick label problem yet, just your plotting
problem.
Ben Root
-------------- next part --------------
An HTML attachment was scrubbed…
Message: 2
Date: Mon, 21 Feb 2011 13:51:21 -0300
From: Wal?ria Antunes David <waleriantunes@…287…>
Subject: Re: [Matplotlib-users] xscale and yscale
To: Benjamin Root <ben.root@…3203…04…>
Cc: Matplotlib Users matplotlib-users@lists.sourceforge.net
Message-ID:
<AANLkTimZwCc-jbWYGoBjVkO9zCDj9UNGTetvdjTZacXd@...288...>Content-Type: text/plain; charset=“iso-8859-1”
So…now my xscale is correct but the yscale …i need that in the yscale
should have a scale like this: 1 - 10 - 100 - 1000 … without using power
rating . Can you help me??
See my image attached…
Thanks,
On Mon, Feb 21, 2011 at 1:32 PM, Benjamin Root <ben.root@…1304…> wrote:
On Mon, Feb 21, 2011 at 10:23 AM, Wal?ria Antunes David < > > > waleriantunes@…287…> wrote:
See my code: http://pastebin.com/xtgKteuW
I need that tn the x-axis should have a scale like this: 0 - 2 - 4 - 6 - 8
- 10 - 12 - 14 and in the y-axis a scale: 1 - 10 - 100 -1000 . See my
images, the image correct_graph is correct.
Thanks,
One problem at a time. You are doing an errorbar plot and then creating a
subplot. The subplot axes will not be the same thing as the axes you just
made the errorbar plot on.
See the correction here: http://pastebin.com/aZEJuGs2
Note, this does not address your tick label problem yet, just your plotting
problem.
Ben Root
-------------- next part --------------
An HTML attachment was scrubbed…
-------------- next part --------------
A non-text attachment was scrubbed…
Name: graph.png
Type: image/png
Size: 27949 bytes
Desc: not available
The ultimate all-in-one performance toolkit: Intel(R) Parallel Studio XE:
Pinpoint memory and threading errors before they happen.
Find and fix more than 250 security defects in the development cycle.
Locate bottlenecks in serial and parallel code that limit performance.
http://p.sf.net/sfu/intel-dev2devfeb
Matplotlib-users mailing list
Matplotlib-users@lists.sourceforge.net
https://lists.sourceforge.net/lists/listinfo/matplotlib-users
End of Matplotlib-users Digest, Vol 57, Issue 60