Mike,
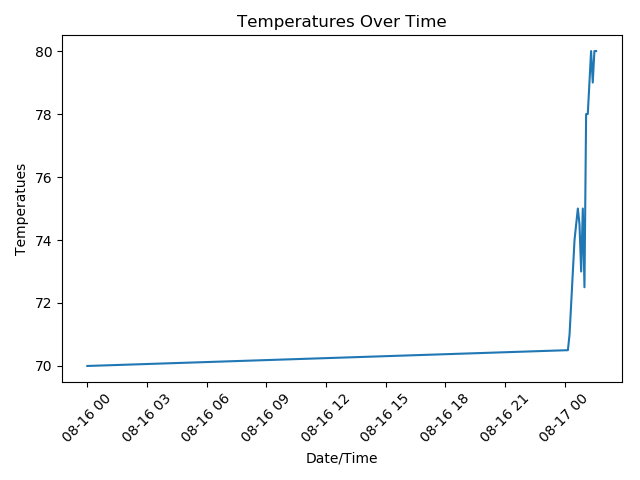
Your plot tick labels are displaying month, day, and hour (the first tick is at the start of August 16, the next is 3 hours later, etc.). This is the default format for an axis of the length in your example. The idea behind the scheme is to provide no more than 3 date time numbers per tick label so as to keep the label from being too long.
You can override the default in two ways: by overriding one or more of the formats used by the rather complex AutoDateFormatter (which is designed to work with the default AutoDateLocator), or by specifying the use of your own DateFormatter in which you directly provide the strftime-style format string to use.
Method 1:
you can change the defaults used by AutoDateFormatter by specifying them in a matplotlibrc file, or by setting them in the rcParams dictionary. In the former case the change must be made before matplotlib is imported; in the latter, it must be before the plot is made. Here are commented-out values from the matplotlibrc template:
#date.autoformatter.year : %Y
#date.autoformatter.month : %Y-%m
#date.autoformatter.day : %Y-%m-%d
#date.autoformatter.hour : %m-%d %H
#date.autoformatter.minute : %d %H:%M
#date.autoformatter.second : %H:%M:%S
#date.autoformatter.microsecond : %M:%S.%f
In the case of your example the ticks are at intervals of 3 hours, so it is the '.hour' entry that would have to be changed. For example, in your script:
plt.rcParams['date.autoformatter.hour'] = '%m-%d %H:%M'
If you are plotting with a variety of axis spans, so that ticks are placed at day multiples, or minute multiples, for example, then you would have to use this method to change those corresponding defaults.
Method 2:
In your script you could add, for example:
import matplotlib.dates as mdates
ax = plt.gca()
formatter = mdates.DateFormatter('%Y-%m-%d %H:%M:%S')
ax.xaxis.set_major_formatter(ax.xaxis.set_major_formatter(formatter))
This way you will have the same standard format regardless of the time range spanned by your axis.
Also, instead of specifying the tick label rotation yourself, you might want to use
plt.gcf().autofmt_xdate()
which will place the end of the rotated string just below the tick.
Eric
···
On 2019/08/18 1:07 PM, Mike Sacauskis wrote:
Hi
I'm new to Matplotlib, I'm going to be plotting some temperature data
over time and wrote a test program to see with Matplotlab can do for
me. When I plot the the date the date time does not display as I would
expect, the date is output but the time is some type of counter not the
time of day as expected. What am I doing wrong? I've attached the
code, data and the resulting image. Any help would be greatly
appreciated.
Mike
_______________________________________________
Matplotlib-users mailing list
[email protected]
Matplotlib-users Info Page
_______________________________________________
Matplotlib-users mailing list
[email protected]
https://mail.python.org/mailman/listinfo/matplotlib-users