I am new to Matplotlib. I created a plot and I want to add a set of straight lines from a set of (x,y) coordinates (2D list). I want to have lines drown from 1st to 2nd then from 3rd to 4th and then from 5th to 6th, etc. I don’t want lines between 2nd and 3rd, 4th and 5th, etc. I think it can be done using Path and Patch, but could not get it done. I even tried to rearrange my data in a way to draw one line piece with zigzag shape but that too did not work well.
Le 03/05/2020 à 01:08, EK Esawi via
Matplotlib-users a écrit :
It suffices to remember that a NAN breaks a plot line. Insert
NANs between the segments
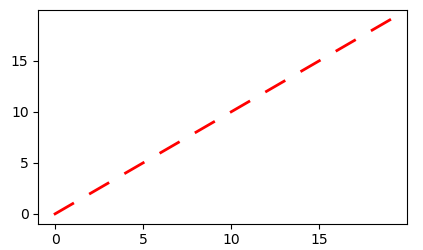
If you try this:
__ import numpy as
np
import matplotlib.pyplot as plt
      x=np.array(range(20))
      x=x.reshape((10,2))  # two columns
      h=np.array([10*[np.nan]]).T
      xx=np.hstack((x,h)).reshape((30,)) # NANs form the third
column; Flatten the result
plt.plot(xx,xx,'r',lw=2)__
you should get:
/Caen, France/
I am new to Matplotlib. I created a plot and I want to add a set of straight lines from a set of (x,y) coordinates (2D list). I want to have lines drown from 1st to 2nd then from 3rd to 4th and then from 5th to 6th, etc. I don’t want lines between 2nd and 3rd, 4th and 5th, etc. I think it can be done using Path and Patch, but could not get it done. I even tried to rearrange my data in a way to draw one line piece with zigzag shape but that too did not work well.
Thank you so much Jerzyfor a the input. your code works perfectly, but i have some problems inserting nan after each 2 coordinate points as you did with numpy except i am trying to use lists instead of numpy plus, it's been a while since i programmed in Python. Once i figure out how to do that then it should work.
Thanks again and best of luck.
EK
···
On Saturday, May 2, 2020, 7:08:02 PM EDT, EK Esawi <[email protected]> wrote:
Hi All—
I am new to Matplotlib. I created a plot and I want to add a set of straight lines from a set of (x,y) coordinates (2D list). I want to have lines drown from 1st to 2nd then from 3rd to 4th and then from 5th to 6th, etc. I don’t want lines between 2nd and 3rd, 4th and 5th, etc. I think it can be done using Path and Patch, but could not get it done. I even tried to rearrange my data in a way to draw one line piece with zigzag shape but that too did not work well.
See specifically the description of segments, which can be either an array of shape (n_segments, n_points, 2), ie (n, 2, 2) in your case, or a list of line segments.
Juan.
···
On Mon, 4 May 2020, at 4:00 AM, Jerzy Karczmarczuk wrote:
On 04/05/2020 8:30 am, EK Esawi via Matplotlib-users wrote:
i am trying to use lists instead of numpy plus, it's been a while since i programmed in Python.
Some advice…
People who too often complain that they are beginners, are
likely to remain beginners forever. Beware.
If you expect to use matplotlib (or plotly, or pyqtgraph,
etc.) frequently, master Numpy, or sooner than you think, you will
suffer very, very much.
My previous example was loop-less; this is one of many
advantages of Numpy. But you can do it in the orthodox way as
well.
** from random
import random as rn
import matplotlib.pyplot as plt
n=20
nan=float(‘nan’)
a=[rn() for k in range(n)] # just a silly random example
      for j in range(n-2,0,-2):
                      a.insert(j,nan)# insert your Nans
in such a way
plt.plot(a)**
Best regards
Jerzy Karczmarczuk
/Caen, France/
This email has been checked for viruses by Avast antivirus software.