Hi,
I am getting a strange error while platting a graph in the matplotlib widget embedded in a PyQt form.
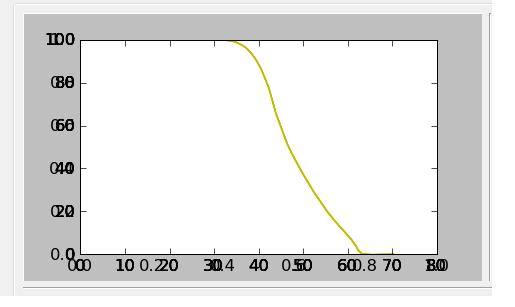
Initially the axis labels range from 0.0 to 1.0, then after plotting these labels fail to disappear, it appears along with the new ticklabels.
Please see the attached screenshot
Thanks
Jothy