What version of mpl are you using? These functions got a lot of work between 1.3 and 1.4.
I also suspects that there is a normalization issue going on with power vs power density.
Tom
···
On Tue, Dec 16, 2014, 22:28 xkryptor <xkryptor@…287…> wrote:
Hi all,
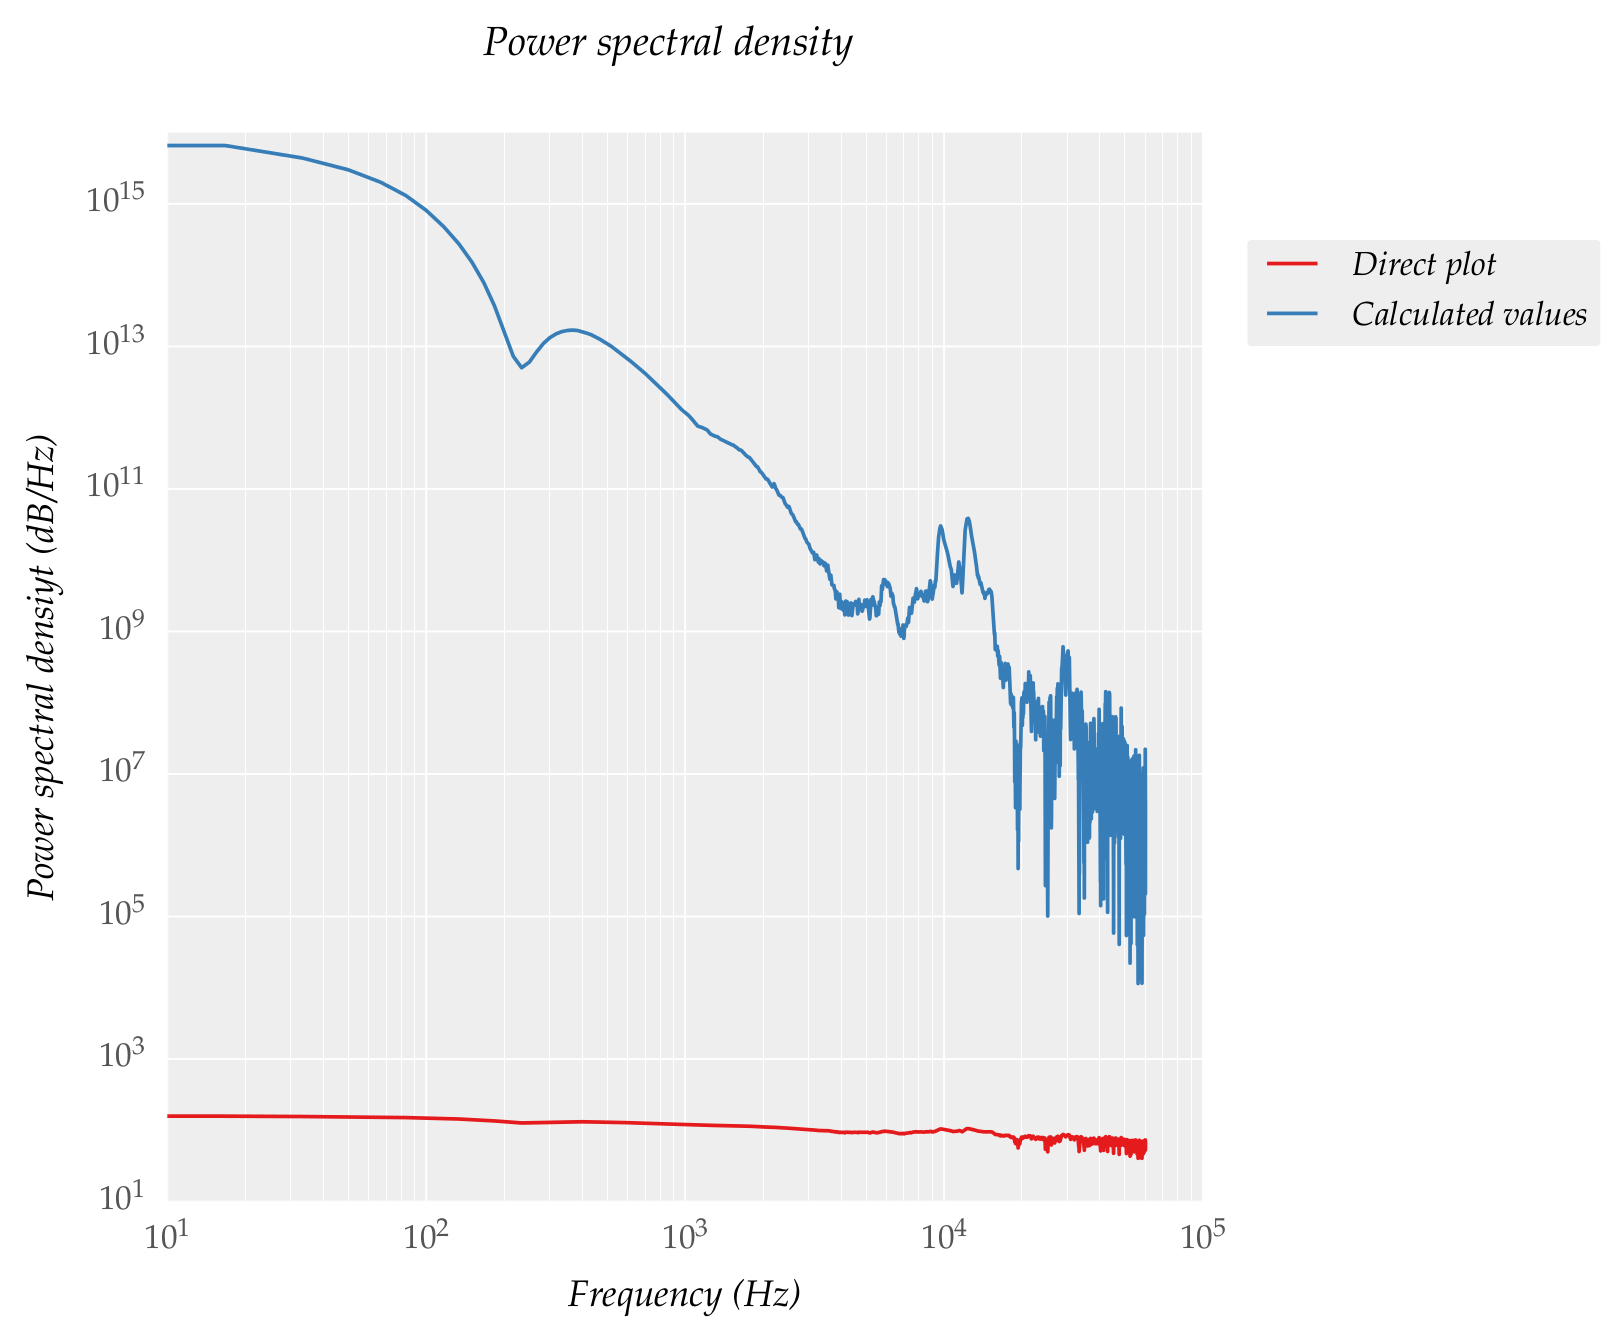
I tried calculating the power spectral density using matplotlib mlab function psd (). I plotted using two methods:
- At first I plot it directly using plt.psd (red line in plot)
- Then I output the values from psd() to variables and plotting the
variables (blue line in plot)
The code I used:
power, freqs = plt.psd(P * 100000, len(P), Fs = 1 / dt, scale_by_freq=0)
plt.psd(P * 100000, len(P), 1 / dt, scale_by_freq=0)
plt.plot(freqs, power)
But the plots are different, I expected it to be coincident. From where does the discrepancy arise?
![Inline image 1]()
Download BIRT iHub F-Type - The Free Enterprise-Grade BIRT Server
from Actuate! Instantly Supercharge Your Business Reports and Dashboards
with Interactivity, Sharing, Native Excel Exports, App Integration & more
Get technology previously reserved for billion-dollar corporations, FREE
http://pubads.g.doubleclick.net/gampad/clk?id=164703151&iu=/4140/ostg.clktrk_______________________________________________
Matplotlib-users mailing list
Matplotlib-users@…1735…sourceforge.net
https://lists.sourceforge.net/lists/listinfo/matplotlib-users
What version of mpl are you using? These functions got a lot of work
between 1.3 and 1.4.
Tom,
Sorry, I answered only in his parallel github issue. matplotlib power spectral density (PSD) value discrepancy · Issue #3927 · matplotlib/matplotlib · GitHub. I'm closing it now. The upshot is that psd returns the power but plots it in db.
Eric
···
On 2014/12/17, 5:37 AM, Thomas Caswell wrote:
I also suspects that there is a normalization issue going on with power
vs power density.
Tom
On Tue, Dec 16, 2014, 22:28 xkryptor <[email protected]... > <mailto:xkryptor@…287…>> wrote:
Hi all,
I tried calculating the power spectral density using matplotlib
mlab function psd (). I plotted using two methods:
1. At first I plot it directly using plt.psd (red line in plot)
2. Then I output the values from psd() to variables and plotting the
variables (blue line in plot)
The code I used:
power, freqs = plt.psd(P * 100000, len(P), Fs = 1 / dt, scale_by_freq=0)
plt.psd(P * 100000, len(P), 1 / dt, scale_by_freq=0)
plt.plot(freqs, power)
But the plots are different, I expected it to be coincident. From
where does the discrepancy arise?
Inline image 1
------------------------------__------------------------------__------------------
Download BIRT iHub F-Type - The Free Enterprise-Grade BIRT Server
from Actuate! Instantly Supercharge Your Business Reports and Dashboards
with Interactivity, Sharing, Native Excel Exports, App Integration &
more
Get technology previously reserved for billion-dollar corporations, FREE
http://pubads.g.doubleclick.__net/gampad/clk?id=164703151&__iu=/4140/ostg.clktrk
<http://pubads.g.doubleclick.net/gampad/clk?id=164703151&iu=/4140/ostg.clktrk>\_\_\_\_\_\_\_\_\_\_\_\_\_\_\_\_\_\_\_\_\_\_\_\_\_\_\_\_\_\_\_\_\_\_\_\_\_\_\_\_\_\_\_\_\_\_\_\_\_
Matplotlib-users mailing list
[email protected]...
<mailto:[email protected]>
https://lists.sourceforge.net/__lists/listinfo/matplotlib-__users
<https://lists.sourceforge.net/lists/listinfo/matplotlib-users>
------------------------------------------------------------------------------
Download BIRT iHub F-Type - The Free Enterprise-Grade BIRT Server
from Actuate! Instantly Supercharge Your Business Reports and Dashboards
with Interactivity, Sharing, Native Excel Exports, App Integration & more
Get technology previously reserved for billion-dollar corporations, FREE
http://pubads.g.doubleclick.net/gampad/clk?id=164703151&iu=/4140/ostg.clktrk
_______________________________________________
Matplotlib-users mailing list
[email protected]
matplotlib-users List Signup and Options