Hi all,
I tried calculating the power spectral density using matplotlib mlab function psd (). I plotted using two methods:
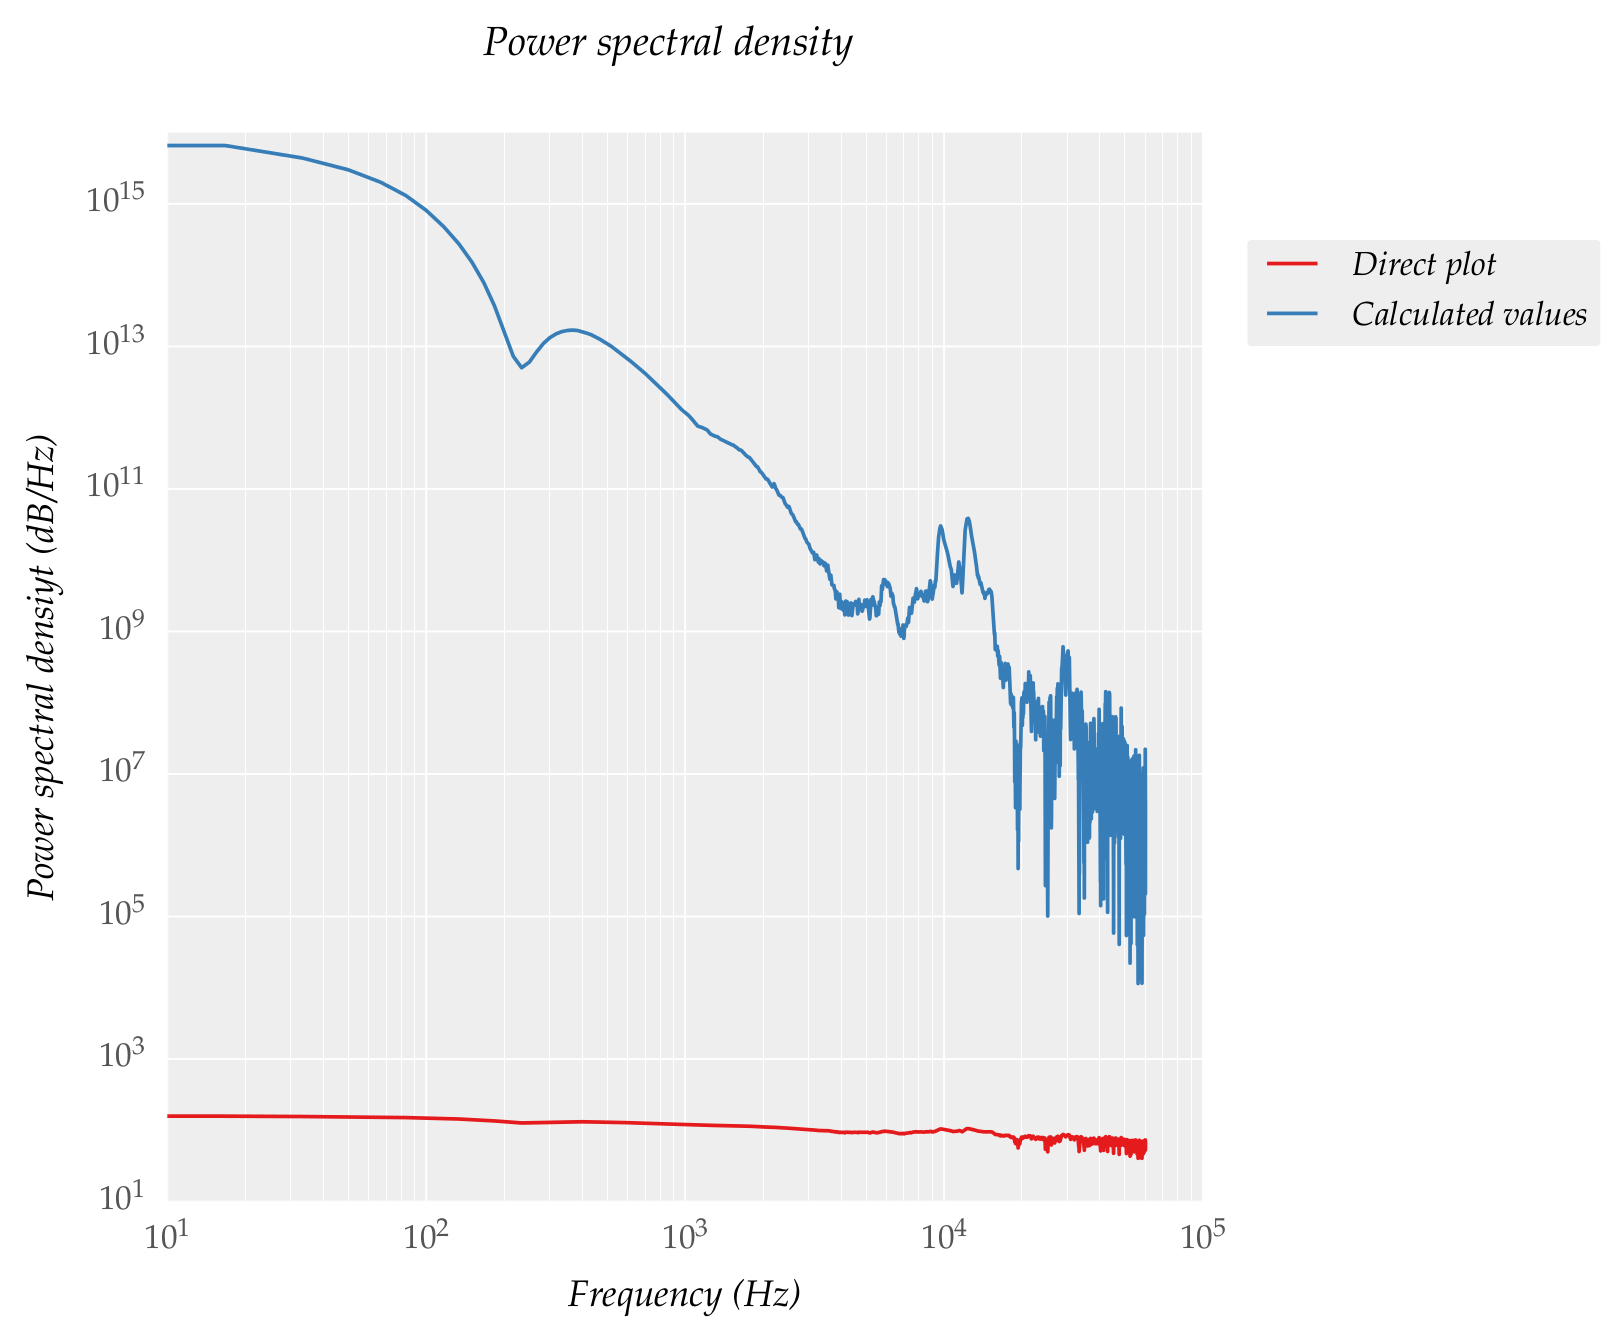
- At first I plot it directly using plt.psd (red line in plot)
- Then I output the values from psd() to variables and plotting the
variables (blue line in plot)
The code I used:
power, freqs = plt.psd(P * 100000, len(P), Fs = 1 / dt, scale_by_freq=0)
plt.psd(P * 100000, len(P), 1 / dt, scale_by_freq=0)
plt.plot(freqs, power)
But the plots are different, I expected it to be coincident. From where does the discrepancy arise?