Hello everyone, I have a question about plotting a diagram with matplotlib. Specifically, I have a chart with degrees Celsius on the x-axis and kbar on the y-axis, and I need to format the axes in such a way that 100 degrees Celsius corresponds to a width of 2 kbar. Maybe it’s quite simple, and I’ve just been looking for the wrong thing, but so far, I haven’t found a solution.
Thanks in advance!
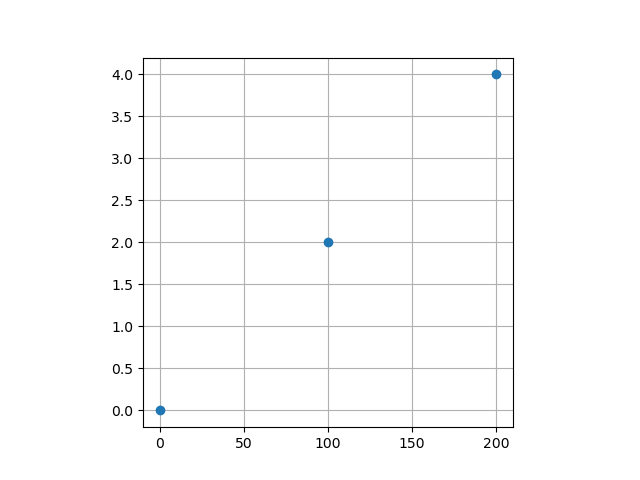
Hi @lockensimon, does set_aspect do what you need?
import matplotlib.pyplot as plt

fig, ax = plt.subplots()

ax.plot([0, 100, 200], [0, 2, 4], 'o')
ax.set_aspect(50)
ax.grid()

plt.show()
Thank you very much! Somehow, I didn’t have that on my radar… This works great!
1 Like