I find myself generating graphs in which I have data through plain text files and these with the help of matplotlib, I get good results. The point is that I need to use some images in which these serve as graphs, they are cut to show the information corresponding to the data.
But here the problem; when using the image with ax.imshow(), I see that the image I use is zoomed for some reason.
I find myself displaying a section of an image on an axis with MatPlotLib imshow(), but as far as I can see, the image is displayed very large on the axis. I see that the image is not conforming to the set_xlim and set_xticks values that are specified.
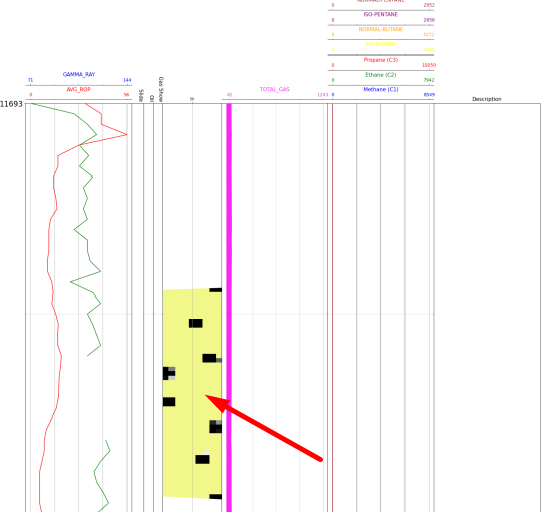
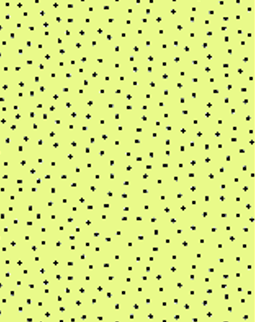
This is what the original image I am referring to looks like:
And so it is shown in the graph:
For what it is seen that the image in the graph has been made a type of zoom that I do not know, because it appears, since the image on the axis is displayed from values lower than 0 and greater than 100, which means that it exceeds the axes specified previously. Also, to emphasize that what is seen as an area marked with black color would be the part of the graph that is not seen in the axis since the image is too enlarged.
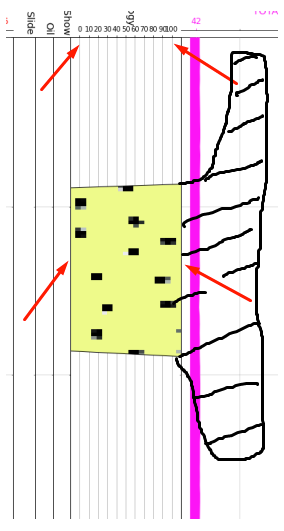
In conclusion: The data and the presentation of the graph are correct, but at the moment of appearing inside the axis, it does not take into account the values of extent=[0, 100, top_depth, top_depth+ 1000], but they exceed the axes established in the axis that were previously configured.
fig, ax = plt.subplots(nrows=1, ncols=8, figsize=(25, 400), dpi=80, sharey=True,
                           gridspec_kw={'width_ratios': [0.9, 0.1, 0.08, 0.08, 0.5, 0.9, 0.9, 0.9],'height_ratios': [5]})
fig.subplots_adjust(top=0.992,wspace=0)
for axes in ax:
        axes.set_ylim(top_depth, bottom_depth)
        axes.set_yticks(GenerateIndex(top_depth, bottom_depth))
        axes.invert_yaxis()
        axes.yaxis.grid(True)
        axes.get_xaxis().set_visible(True)
        axes.get_yaxis().set_visible(True)
        axes.tick_params(labelsize = 20)

#This is how I have the axis configured:
ax52=ax[4].twiny()
ax52.set_xlim(-10, 110)
ax52.set_xticks([0,10,20,30,40,50,60,70,80,90,100])
ax52.xaxis.grid(False)
ax52.yaxis.grid(False)
ax52.get_xaxis().set_visible(False)


#And this way I have it configured to show me the image:
image2 = None
image2 = ax52.imshow(Image.open(pathDir + 'Sand.png'), cmap=plt.cm.gray, extent=[0, 100, top_depth, top_depth+ 1000])
poly2 = ax52.fill_betweenx(ControlStart2['DEPTH'], ControlStart2['Sand'], ControlEnd2['Sand'], facecolor='none', visible=True)
clip2 = poly2.get_paths()[0]
image2.set_clip_path(clip2, transform=ax52.transData)
The final result I need would be as follows:
- That the image is adjusted and not presented zoomed.
- That the image is within the limits of the x-axis.
I have done a single test with a single axi but with the same structure in another file, and I got what I want:
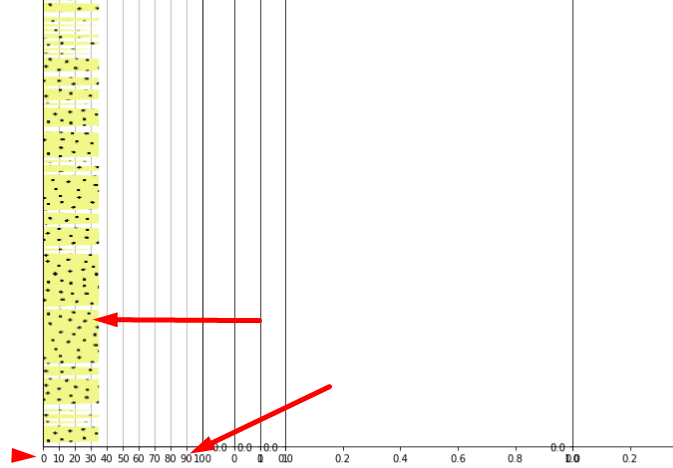
I apply absolutely the same logic to add the image, but for some reason I don’t get the same results.