Dear matplotlib users
On my search for a good drawing API for Python I discovered matplotlib. It has most of the features that I would like to see in a Python vector drawing API.
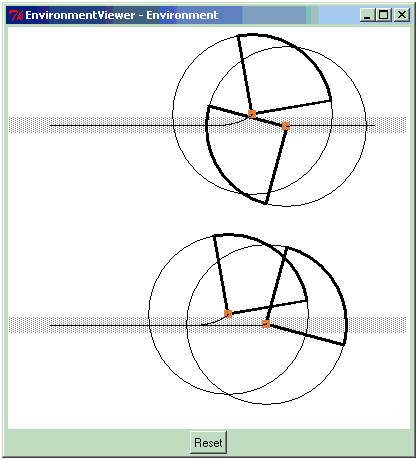
My problem is to visualise the process of a simulation, thus vector graphics objects controlled by a simulation program. At the moment I use a Tkinter Canvas, but it is very limiting. Look at the attached image for an example: cars driving on roads and trying to avoid crashing (Windows version). Imagine the cars driving around, of course!
What I need is something similar to the Java2D API or JGraph. I need the following features:
- interactive (by application, not user) creation and modification of graphics primitives, such as circles, text, rects, arcs, arrows, splines, etc.
- transparency (alpha blending)
- anti-aliasing
- rotation, skewing, scaling, etc.
- SVG output ?
Can matplotlib be used for visualising simulations? I do not need the axes and the various diagrams, but the rest is already there, it seems.
I have already looked at Tkinter and wxPython/OGL, but neither seems to do what I want.
Thanks for your help.
Andre
Java2D
http://java.sun.com/products/java-media/2D/index.jsp
http://java.sun.com/docs/books/tutorial/2d/display/strokeandfill.html
http://java.sun.com/j2se/1.4.2/docs/guide/2d/spec/j2d-awt.html#wp64995
JGraph
http://www.jgraph.com/showcase.html
···
--
Dr. Andre P. Meyer http://home.hccnet.nl/a.meyer/
TNO FEL Command & Control and Simulation, http://www.fel.tno.nl/div2/
Delft Cooperation on Intelligent Systems, http://www.decis.nl/
--
------------------------------------------------------------------------------
The disclaimer that applies to e-mail from
TNO Physics and Electronics Laboratory
can be found on: http://www.tno.nl/disclaimer/email.html
------------------------------------------------------------------------------