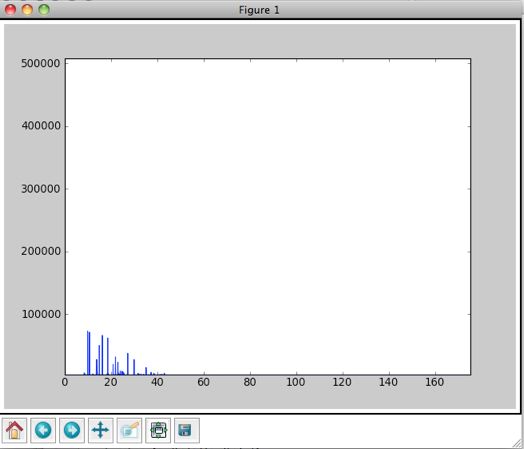
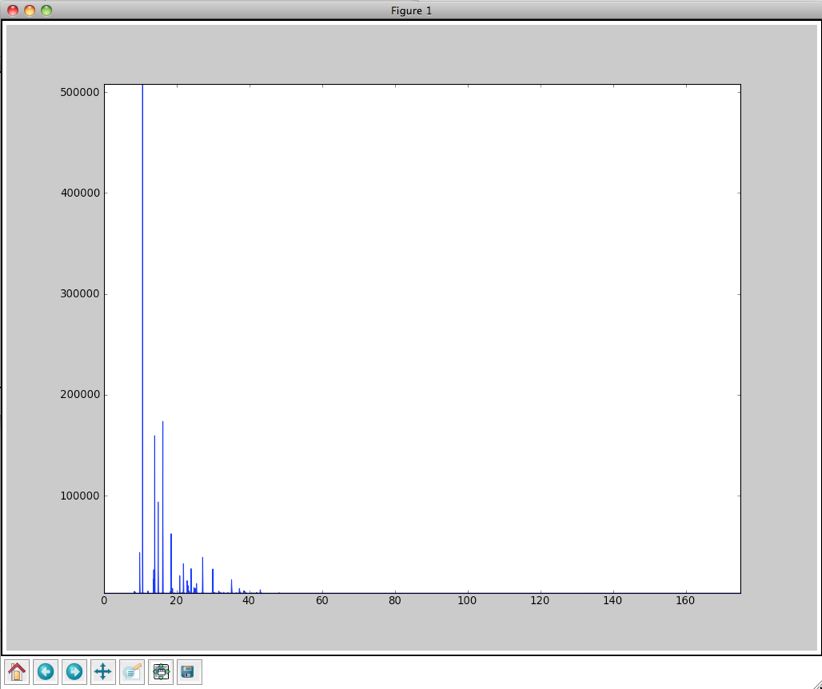
I'm plotting 50,000 data point signal as a line plot to the standard
matplotlib window and scaling the axis to the maximum value of the signal.
Depending on the size of the matplotlib window, the displayed graph
changes both the number of displayed peaks and their amplitude. Can anyone
help me correctly display the data. ( do I need to turn off some
smoothing control which reduces the number of points actually displayed?)
here's the plot function:
def plotsig(sig):
plt.cla()
plt.plot(sig[:,0],sig[:,1])
plt.axis([np.min(sig[:,0]),np.max(sig[:,0]),np.min(sig[:,1]),np.max(sig[:,1])])
plt.savefig('sig.png')
plt.show()
Two fig attached.
thanks for any help
It looks like you're hitting the well-known bug in the path simplification algorithm. You can turn it off be setting the "path.simplify" rcParam to False. (Or you can upgrade to SVN where this has been fixed...)
Mike
david@...3089... wrote:
···
I'm plotting 50,000 data point signal as a line plot to the standard
matplotlib window and scaling the axis to the maximum value of the signal.
Depending on the size of the matplotlib window, the displayed graph
changes both the number of displayed peaks and their amplitude. Can anyone
help me correctly display the data. ( do I need to turn off some
smoothing control which reduces the number of points actually displayed?)
here's the plot function:
def plotsig(sig):
plt.cla()
plt.plot(sig[:,0],sig[:,1])
plt.axis([np.min(sig[:,0]),np.max(sig[:,0]),np.min(sig[:,1]),np.max(sig[:,1])])
plt.savefig('sig.png')
plt.show()
Two fig attached.
thanks for any help
------------------------------------------------------------------------
------------------------------------------------------------------------
------------------------------------------------------------------------
------------------------------------------------------------------------------
------------------------------------------------------------------------
_______________________________________________
Matplotlib-users mailing list
Matplotlib-users@lists.sourceforge.net
matplotlib-users List Signup and Options
--
Michael Droettboom
Science Software Branch
Operations and Engineering Division
Space Telescope Science Institute
Operated by AURA for NASA
Thanks Michael
It was odd that in all the matplotlib rc files the path.simplify was set to False but when running the program the state toggled True so I had to manually set it in the program.
Strange but that did the trick!
thanks again for your help!
···
On May 6, 2010, at 12:22 PM, Michael Droettboom wrote:
It looks like you're hitting the well-known bug in the path simplification algorithm. You can turn it off be setting the "path.simplify" rcParam to False. (Or you can upgrade to SVN where this has been fixed...)
Mike
david@...3089... wrote:
I'm plotting 50,000 data point signal as a line plot to the standard
matplotlib window and scaling the axis to the maximum value of the signal.
Depending on the size of the matplotlib window, the displayed graph
changes both the number of displayed peaks and their amplitude. Can anyone
help me correctly display the data. ( do I need to turn off some
smoothing control which reduces the number of points actually displayed?)
here's the plot function:
def plotsig(sig):
plt.cla()
plt.plot(sig[:,0],sig[:,1])
plt.axis([np.min(sig[:,0]),np.max(sig[:,0]),np.min(sig[:,1]),np.max(sig[:,1])])
plt.savefig('sig.png')
plt.show()
Two fig attached.
thanks for any help
------------------------------------------------------------------------
------------------------------------------------------------------------
------------------------------------------------------------------------
------------------------------------------------------------------------------
------------------------------------------------------------------------
_______________________________________________
Matplotlib-users mailing list
Matplotlib-users@lists.sourceforge.net
matplotlib-users List Signup and Options
--
Michael Droettboom
Science Software Branch
Operations and Engineering Division
Space Telescope Science Institute
Operated by AURA for NASA