To: [email protected]
Message-ID: [email protected]….cuni.cz
Hi,
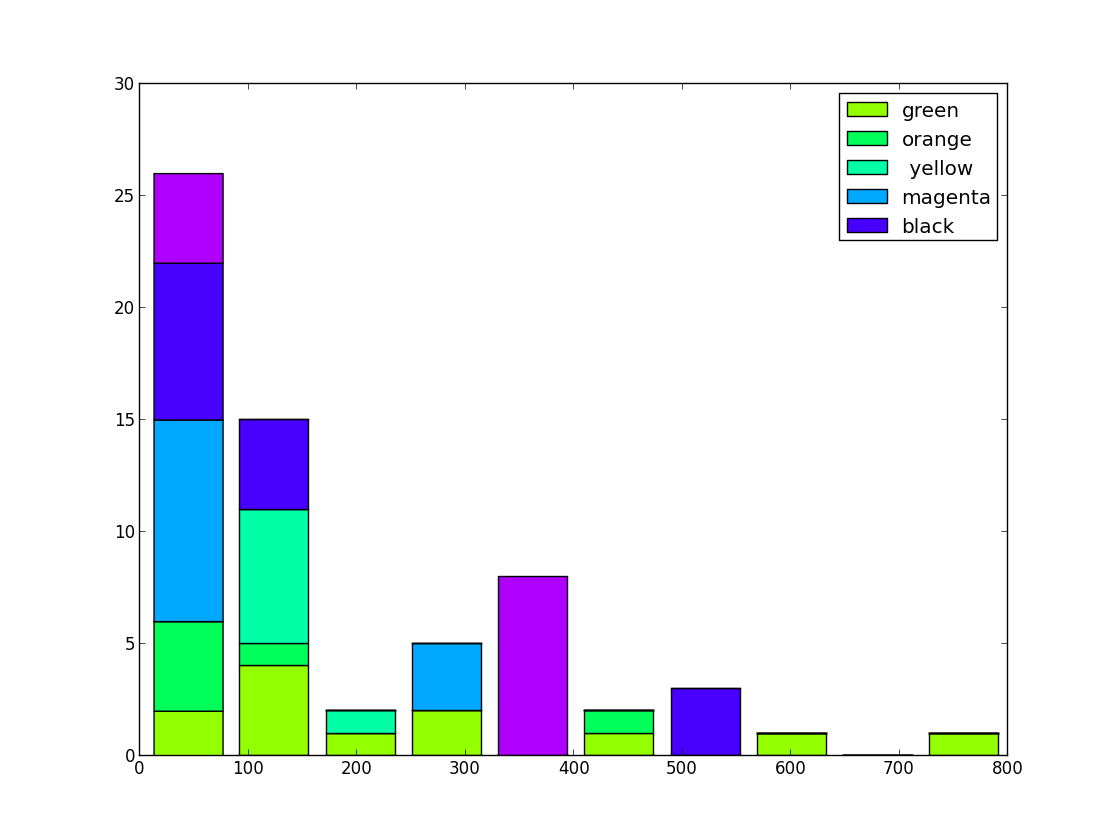
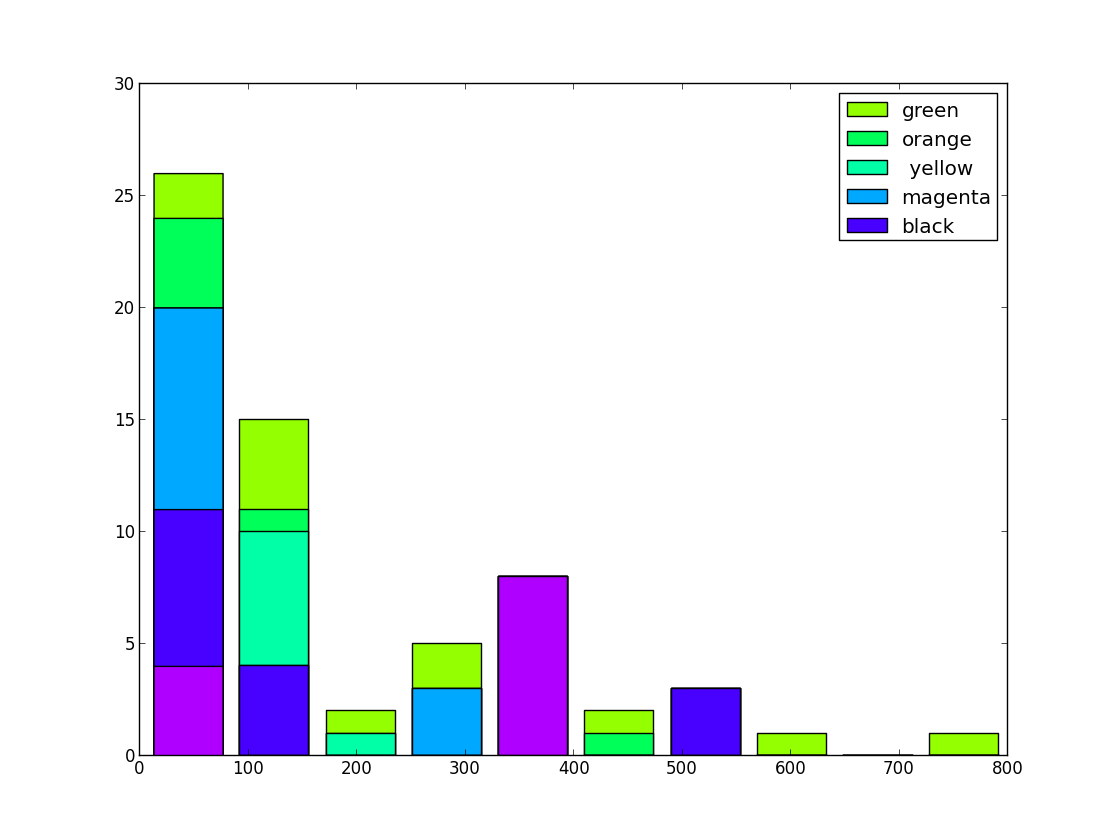
I recently updated to matplotlib-1.2.0 from 1.1.1 and my figures have rotated
order of color bars stacked upon each other. Here is a small testcase I sketched
now and two generated png files are attached, generated by the two different
matplotlib versions. The colornames are just bad in the legend, just to show that
the order of input data is same in both cases.
I would be grateful for any comments on this.
Thank you,
Martin
# ! /usr/bin/python
import pylab
F = pylab.gcf()
F.set_size_inches(11.2, 8.4)
_e = [[100, 100, 100, 100, 200, 320, 450, 80, 20, 600, 310, 800], [20, 23, 50, 11, 100, 420], [120, 120, 120, 140, 140, 150, 180], [60, 60, 60, 60, 300, 300, 5, 5, 5, 5, 10, 300], [555, 555, 555, 30, 30, 30, 30, 30, 100, 100, 100, 100, 30, 30], [30, 30, 30, 30, 400, 400, 400, 400, 400, 400, 400, 400]]
_ee = [(0.5759849696758961, 1.0, 0.0), (0.0, 1.0, 0.350624650815206), (0.0, 1.0, 0.6549834156005998), (0.0, 0.6569064625276622, 1.0), (0.28302699607823545, 0.0, 1.0), (0.6849123462299822, 0.0, 1.0)]
_eee = ['green', 'orange', ' yellow', 'magenta', 'black']
pylab.hist(_e, bins=10, histtype='barstacked', align='mid', color=_ee, log=False, label=_eee)
pylab.legend(loc='upper right', bbox_to_anchor = (1.0, 1.0), ncol=1)
F.savefig("hist_barstacked_bug.png", dpi=100)