Hi everybody,
I have some probleme with Matplot/numpy !
I'm using matplot v0.91.2 and I'm trying to get the hist function working !!
I'm using the sample code of matplot:
···
----------------------------------------------------------
#!/usr/bin/env python
import numpy as np
import matplotlib.mlab as mlab
import matplotlib.pyplot as plt
mu, sigma = 100, 15
x = mu + sigma*np.random.randn(10000)
# the histogram of the data
n, bins, patches = plt.hist(x, 50, normed=1, facecolor='green', alpha=0.75)
print len(n)
print len(bins)
print n
print bins
# add a 'best fit' line
y = mlab.normpdf( bins, mu, sigma)
l = plt.plot(bins, y, 'r--', linewidth=1)
plt.xlabel('Smarts')
plt.ylabel('Probability')
plt.title(r'$\mathrm{Histogram\ of\ IQ:}\ \mu=100,\ \sigma=15$')
plt.axis([40, 160, 0, 0.03])
plt.grid(True)
plt.show()
------------------------------------------------------------
With the same matplot lib but a different version of numpy I get 2 different
number of bins !!! How is that possible ???
using the 1.0.4 version of numpy, I get len(n) = 50 and len(bins) = 50 ...
what sounds pretty right to me !! but using the version 1.2.1 (the last one
I guess) I got len(n) = 50 and len(bins) = 51 What looks weird, doesn't it
???
do you guys have an explanation ??
Anybody faced the same problem ?
thx, Jerome
--
View this message in context: http://www.nabble.com/Matplot-Numpy-possible-bug-!-tp24145696p24145696.html
Sent from the matplotlib - users mailing list archive at Nabble.com.
Hi everybody,
I have some probleme with Matplot/numpy !
I'm using matplot v0.91.2 and I'm trying to get the hist function working !!
a rather old version of matplotlib (that's the name of the project):
we are at 0.98.5.3; try to upgrade and see if the situation improves.
Also, you don't specify the Numpy version (even if I think it's not
relevant here).
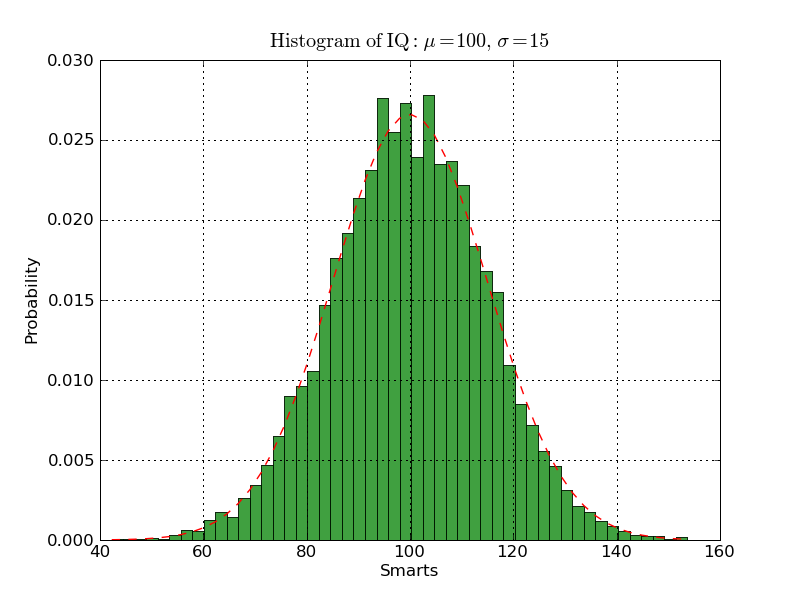
I'm using the sample code of matplot:
with this same code and 0.98.5.3 I got the image attached
With the same matplot lib but a different version of numpy I get 2 different
number of bins !!! How is that possible ???
using the 1.0.4 version of numpy, I get len(n) = 50 and len(bins) = 50 ...
what sounds pretty right to me !! but using the version 1.2.1 (the last one
I guess) I got len(n) = 50 and len(bins) = 51 What looks weird, doesn't it
???
do you guys have an explanation ??
Anybody faced the same problem ?
try to update matplotlib.
Writing note: your usage of several '?' and '!' could lead to upset
people, me for example. one char is enough to express the concept, no
need to repeat since it means you're screaming and "order" us to
reply, which is never the case on OSS projects users mailinglist.
Regards,
···
On Mon, Jun 22, 2009 at 13:33, jmariette<Jerome.Mariette@...2657...> wrote:
--
Sandro Tosi (aka morph, morpheus, matrixhasu)
My website: http://matrixhasu.altervista.org/
Me at Debian: http://wiki.debian.org/SandroTosi
Hi and thanks for the answer !!
no more trouble 
Jerome
Sandro Tosi a écrit :
···
On Mon, Jun 22, 2009 at 13:33, > jmariette<Jerome.Mariette@...2657...> wrote:
Hi everybody,
I have some probleme with Matplot/numpy !
I'm using matplot v0.91.2 and I'm trying to get the hist function working !!
a rather old version of matplotlib (that's the name of the project):
we are at 0.98.5.3; try to upgrade and see if the situation improves.
Also, you don't specify the Numpy version (even if I think it's not
relevant here).
I'm using the sample code of matplot:
with this same code and 0.98.5.3 I got the image attached
With the same matplot lib but a different version of numpy I get 2 different
number of bins !!! How is that possible ???
using the 1.0.4 version of numpy, I get len(n) = 50 and len(bins) = 50 ...
what sounds pretty right to me !! but using the version 1.2.1 (the last one
I guess) I got len(n) = 50 and len(bins) = 51 What looks weird, doesn't it
???
do you guys have an explanation ??
Anybody faced the same problem ?
try to update matplotlib.
Writing note: your usage of several '?' and '!' could lead to upset
people, me for example. one char is enough to express the concept, no
need to repeat since it means you're screaming and "order" us to
reply, which is never the case on OSS projects users mailinglist.
Regards,
------------------------------------------------------------------------
Hi Jerome,
although your problem seems to solved, I would like to state a small remark
about the different number of bins. Some time ago numpy changed the default
of using left bin edges to using all bin edges. Newer versions of matplotlib
handle this difference pretty well, but maybe your old version didn't know
about this quite new numpy feature. I faced this problem some month ago as an
old script got sticked and raised some weird error. As Sandro suggested the
best way is to update matplotlib.
best regards Matthias
···
On Monday 22 June 2009 13:33:46 jmariette wrote:
Hi everybody,
I have some probleme with Matplot/numpy !
I'm using matplot v0.91.2 and I'm trying to get the hist function working
!!
I'm using the sample code of matplot:
----------------------------------------------------------
#!/usr/bin/env python
import numpy as np
import matplotlib.mlab as mlab
import matplotlib.pyplot as plt
mu, sigma = 100, 15
x = mu + sigma*np.random.randn(10000)
# the histogram of the data
n, bins, patches = plt.hist(x, 50, normed=1, facecolor='green', alpha=0.75)
print len(n)
print len(bins)
print n
print bins
# add a 'best fit' line
y = mlab.normpdf( bins, mu, sigma)
l = plt.plot(bins, y, 'r--', linewidth=1)
plt.xlabel('Smarts')
plt.ylabel('Probability')
plt.title(r'\\mathrm\{Histogram\\ of\\ IQ:\}\\ \\mu=100,\\ \\sigma=15')
plt.axis([40, 160, 0, 0.03])
plt.grid(True)
plt.show()
------------------------------------------------------------
With the same matplot lib but a different version of numpy I get 2
different number of bins !!! How is that possible ???
using the 1.0.4 version of numpy, I get len(n) = 50 and len(bins) = 50 ...
what sounds pretty right to me !! but using the version 1.2.1 (the last one
I guess) I got len(n) = 50 and len(bins) = 51 What looks weird, doesn't it
???
do you guys have an explanation ??
Anybody faced the same problem ?
thx, Jerome