Fowarding to the list ...
···
---------- Forwarded message ----------
From: Antonino Ingargiola <tritemio@...287...>
Date: 4-mag-2007 11.12
Subject: Re: [Matplotlib-users] matplolib equivalent of gnuplot's impulse
To: Emmanuel <emmanuel@...1321...>
Hi,
On 5/3/07, Emmanuel <emmanuel@...1321...> wrote:
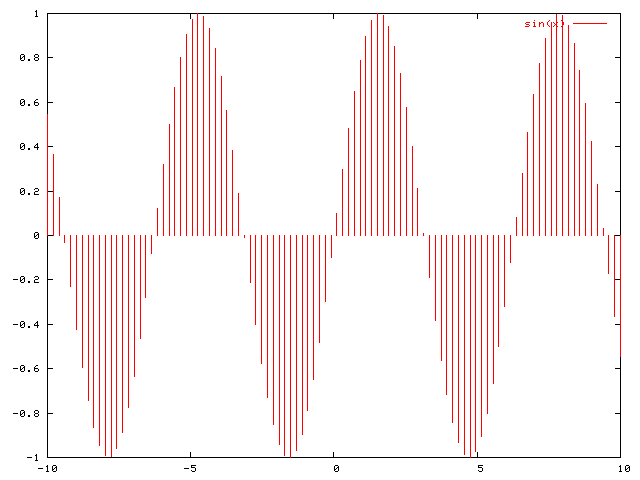
With gnuplot one can do a plot like that :
http://www.deqnotes.net/gnuplot/images/impulses.png
It is using option "with impulse".
Is there an equivalent in matplotlib?
Maybe not directly as a "plot style". But...
If you need to fill the curve with a color you can see this example:
http://matplotlib.sourceforge.net/screenshots/fill_demo.py
If you need the "bar" itself you can use the bar() function.
If you need impulses composed by just "a line" you can use this function:
def impulse(X, Y, color='blue', **kwargs):
"""Plot an "impulse" graph similar to the gnuplot 'impulse' function."""
if len(X) != len(Y):
raise ValueError, "X and Y data must be of the same length."
ax = gca()
for x, y in zip(X, Y):
ax.plot([x, x], [0, y], color=color, **kwargs)
You can pass to it any plot() keyword-argument to customize line style.
Cheers,
~ Antonio