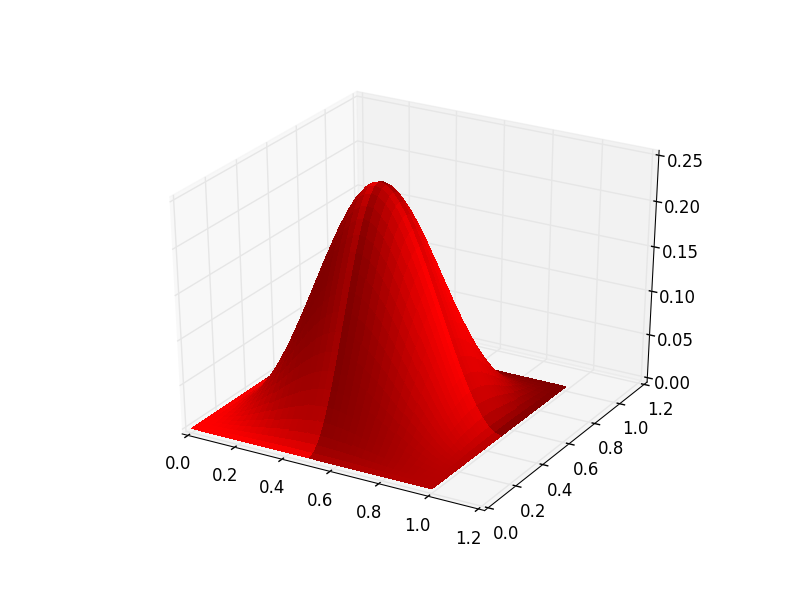
I have a surface that is defined in four distinct sections. The sections are continuous and at least C^1 smooth at the interface. When I plot this in 3D with matplotlib, each section is shaded differently. Is it possible to make the shading uniform? I have attached a figure. The main goal is to make this look like one continuous surface. Thanks,
Derek
Shading is a bit complicated in plot_surface(). In your particular case, it is simply shading based on the results of calculating the normal vector of each facet on the surface. It then normalizes the shading it has to do based on what it has to get the full dynamic. This is why your image looks the way it does (plus, there might be an issue where the normals for one of your pieces is pointed inward instead of outward, probably due to the order of the datapoints for the surface).
You can turn off shading altogether by simply passing shade=False as a keyword argument to plot_surface().
I hope that helps!
Ben Root
···
On Fri, Dec 6, 2013 at 12:43 PM, Derek Thomas <derekcthomas@…287…> wrote:
I have a surface that is defined in four distinct sections. The sections are continuous and at least C^1 smooth at the interface. When I plot this in 3D with matplotlib, each section is shaded differently. Is it possible to make the shading uniform? I have attached a figure. The main goal is to make this look like one continuous surface. Thanks,
Derek
Sponsored by Intel(R) XDK
Develop, test and display web and hybrid apps with a single code base.
Download it for free now!
http://pubads.g.doubleclick.net/gampad/clk?id=111408631&iu=/4140/ostg.clktrk
Matplotlib-users mailing list
[email protected]
https://lists.sourceforge.net/lists/listinfo/matplotlib-users
Thanks Ben. I had tried turning off the shading but that makes it impossible to see the features of the surface. I ended up combining the surface values and resampling with scipy.interpolate.griddata so that I have a single surface.
Derek
···
On Fri, Dec 6, 2013 at 12:23 PM, Benjamin Root <ben.root@…1304…> wrote:
Shading is a bit complicated in plot_surface(). In your particular case, it is simply shading based on the results of calculating the normal vector of each facet on the surface. It then normalizes the shading it has to do based on what it has to get the full dynamic. This is why your image looks the way it does (plus, there might be an issue where the normals for one of your pieces is pointed inward instead of outward, probably due to the order of the datapoints for the surface).
You can turn off shading altogether by simply passing shade=False as a keyword argument to plot_surface().
I hope that helps!
Ben Root
On Fri, Dec 6, 2013 at 12:43 PM, Derek Thomas <derekcthomas@…287…> wrote:
I have a surface that is defined in four distinct sections. The sections are continuous and at least C^1 smooth at the interface. When I plot this in 3D with matplotlib, each section is shaded differently. Is it possible to make the shading uniform? I have attached a figure. The main goal is to make this look like one continuous surface. Thanks,
Derek
Sponsored by Intel(R) XDK
Develop, test and display web and hybrid apps with a single code base.
Download it for free now!
http://pubads.g.doubleclick.net/gampad/clk?id=111408631&iu=/4140/ostg.clktrk
Matplotlib-users mailing list
[email protected]
https://lists.sourceforge.net/lists/listinfo/matplotlib-users