Marsilea is a framework for creating composable visualization in a declarative way. If you have a complicated and nested dataset, and you want to show many information at once in a tidy style, you have come to the right place!
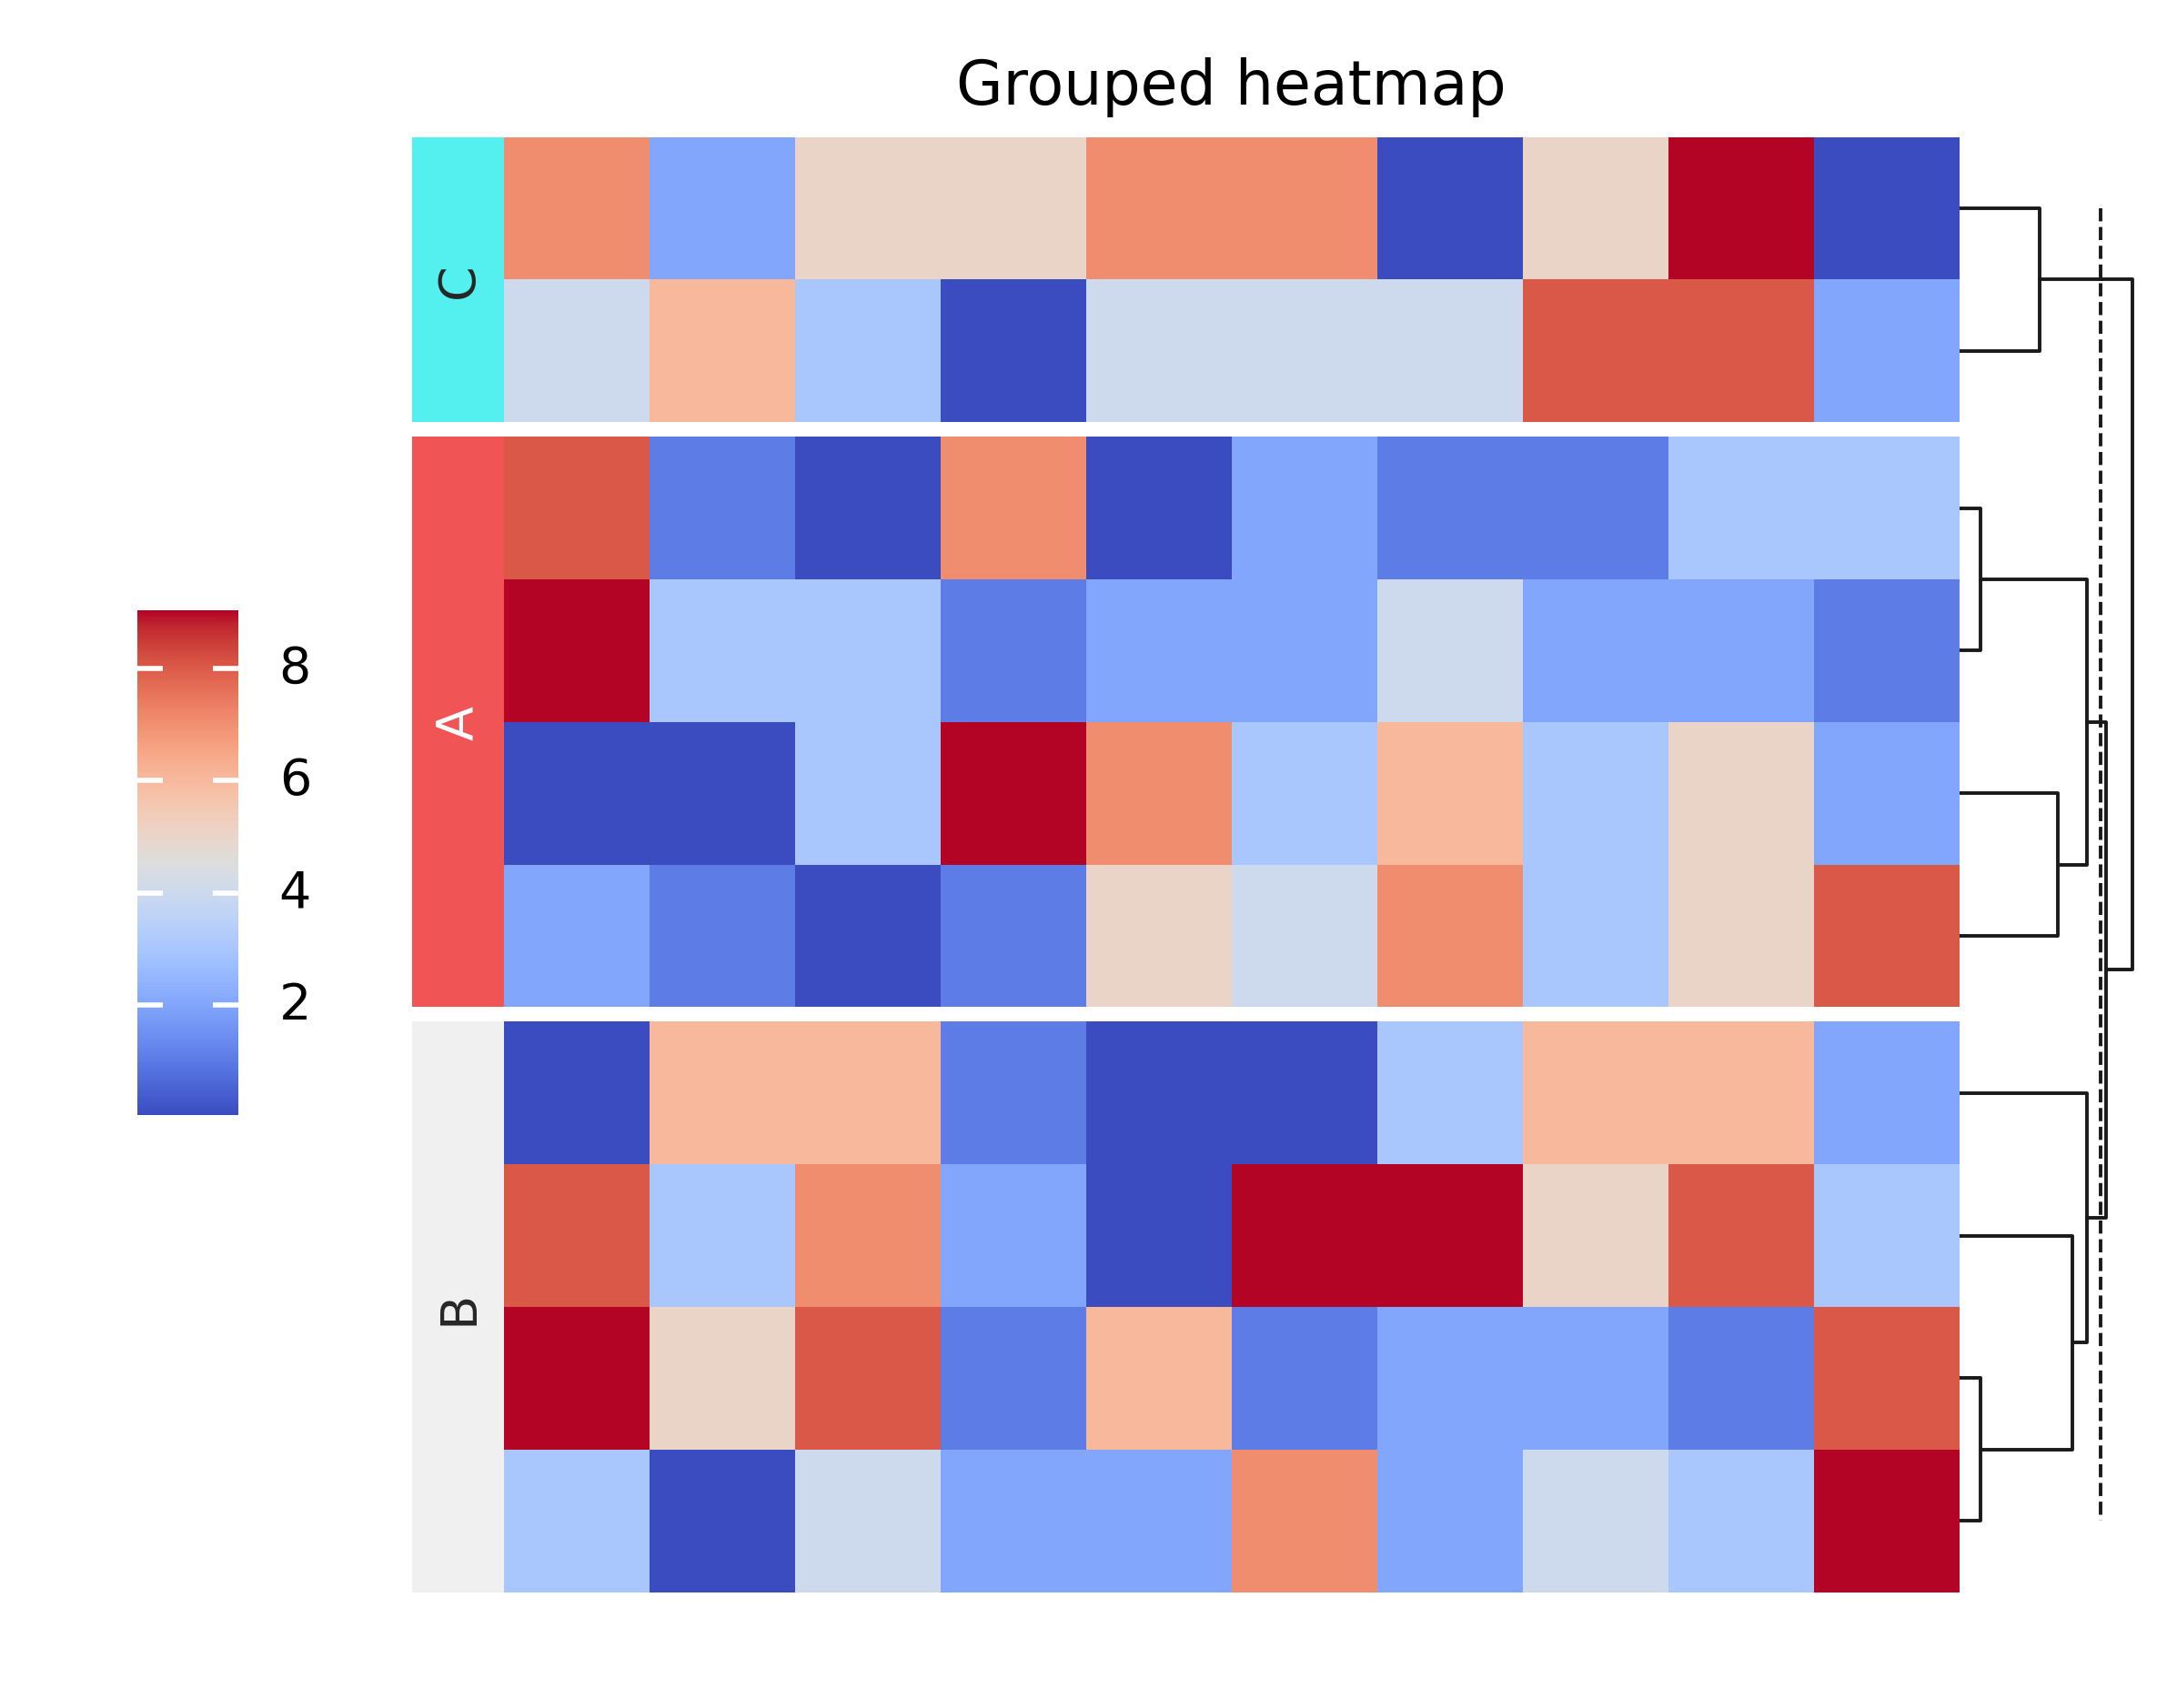
Here is a simple example of how to draw a heatmap with different elements.
import numpy as np
import marsilea as ma

data = np.random.randint(0, 10, (10, 10))
groups = np.random.choice(["A", "B", "C"], 10)

h = ma.Heatmap(data)
h.add_dendrogram("right")
h.group_rows(groups, order=["A", "B", "C"])
h.add_left(ma.plotter.Chunk(["A", "B", "C"], fill_colors=["#F05454", "#F0F0F0", "#54F0F0"]))
h.add_legends("left")
h.add_title("Grouped heatmap")
h.render()
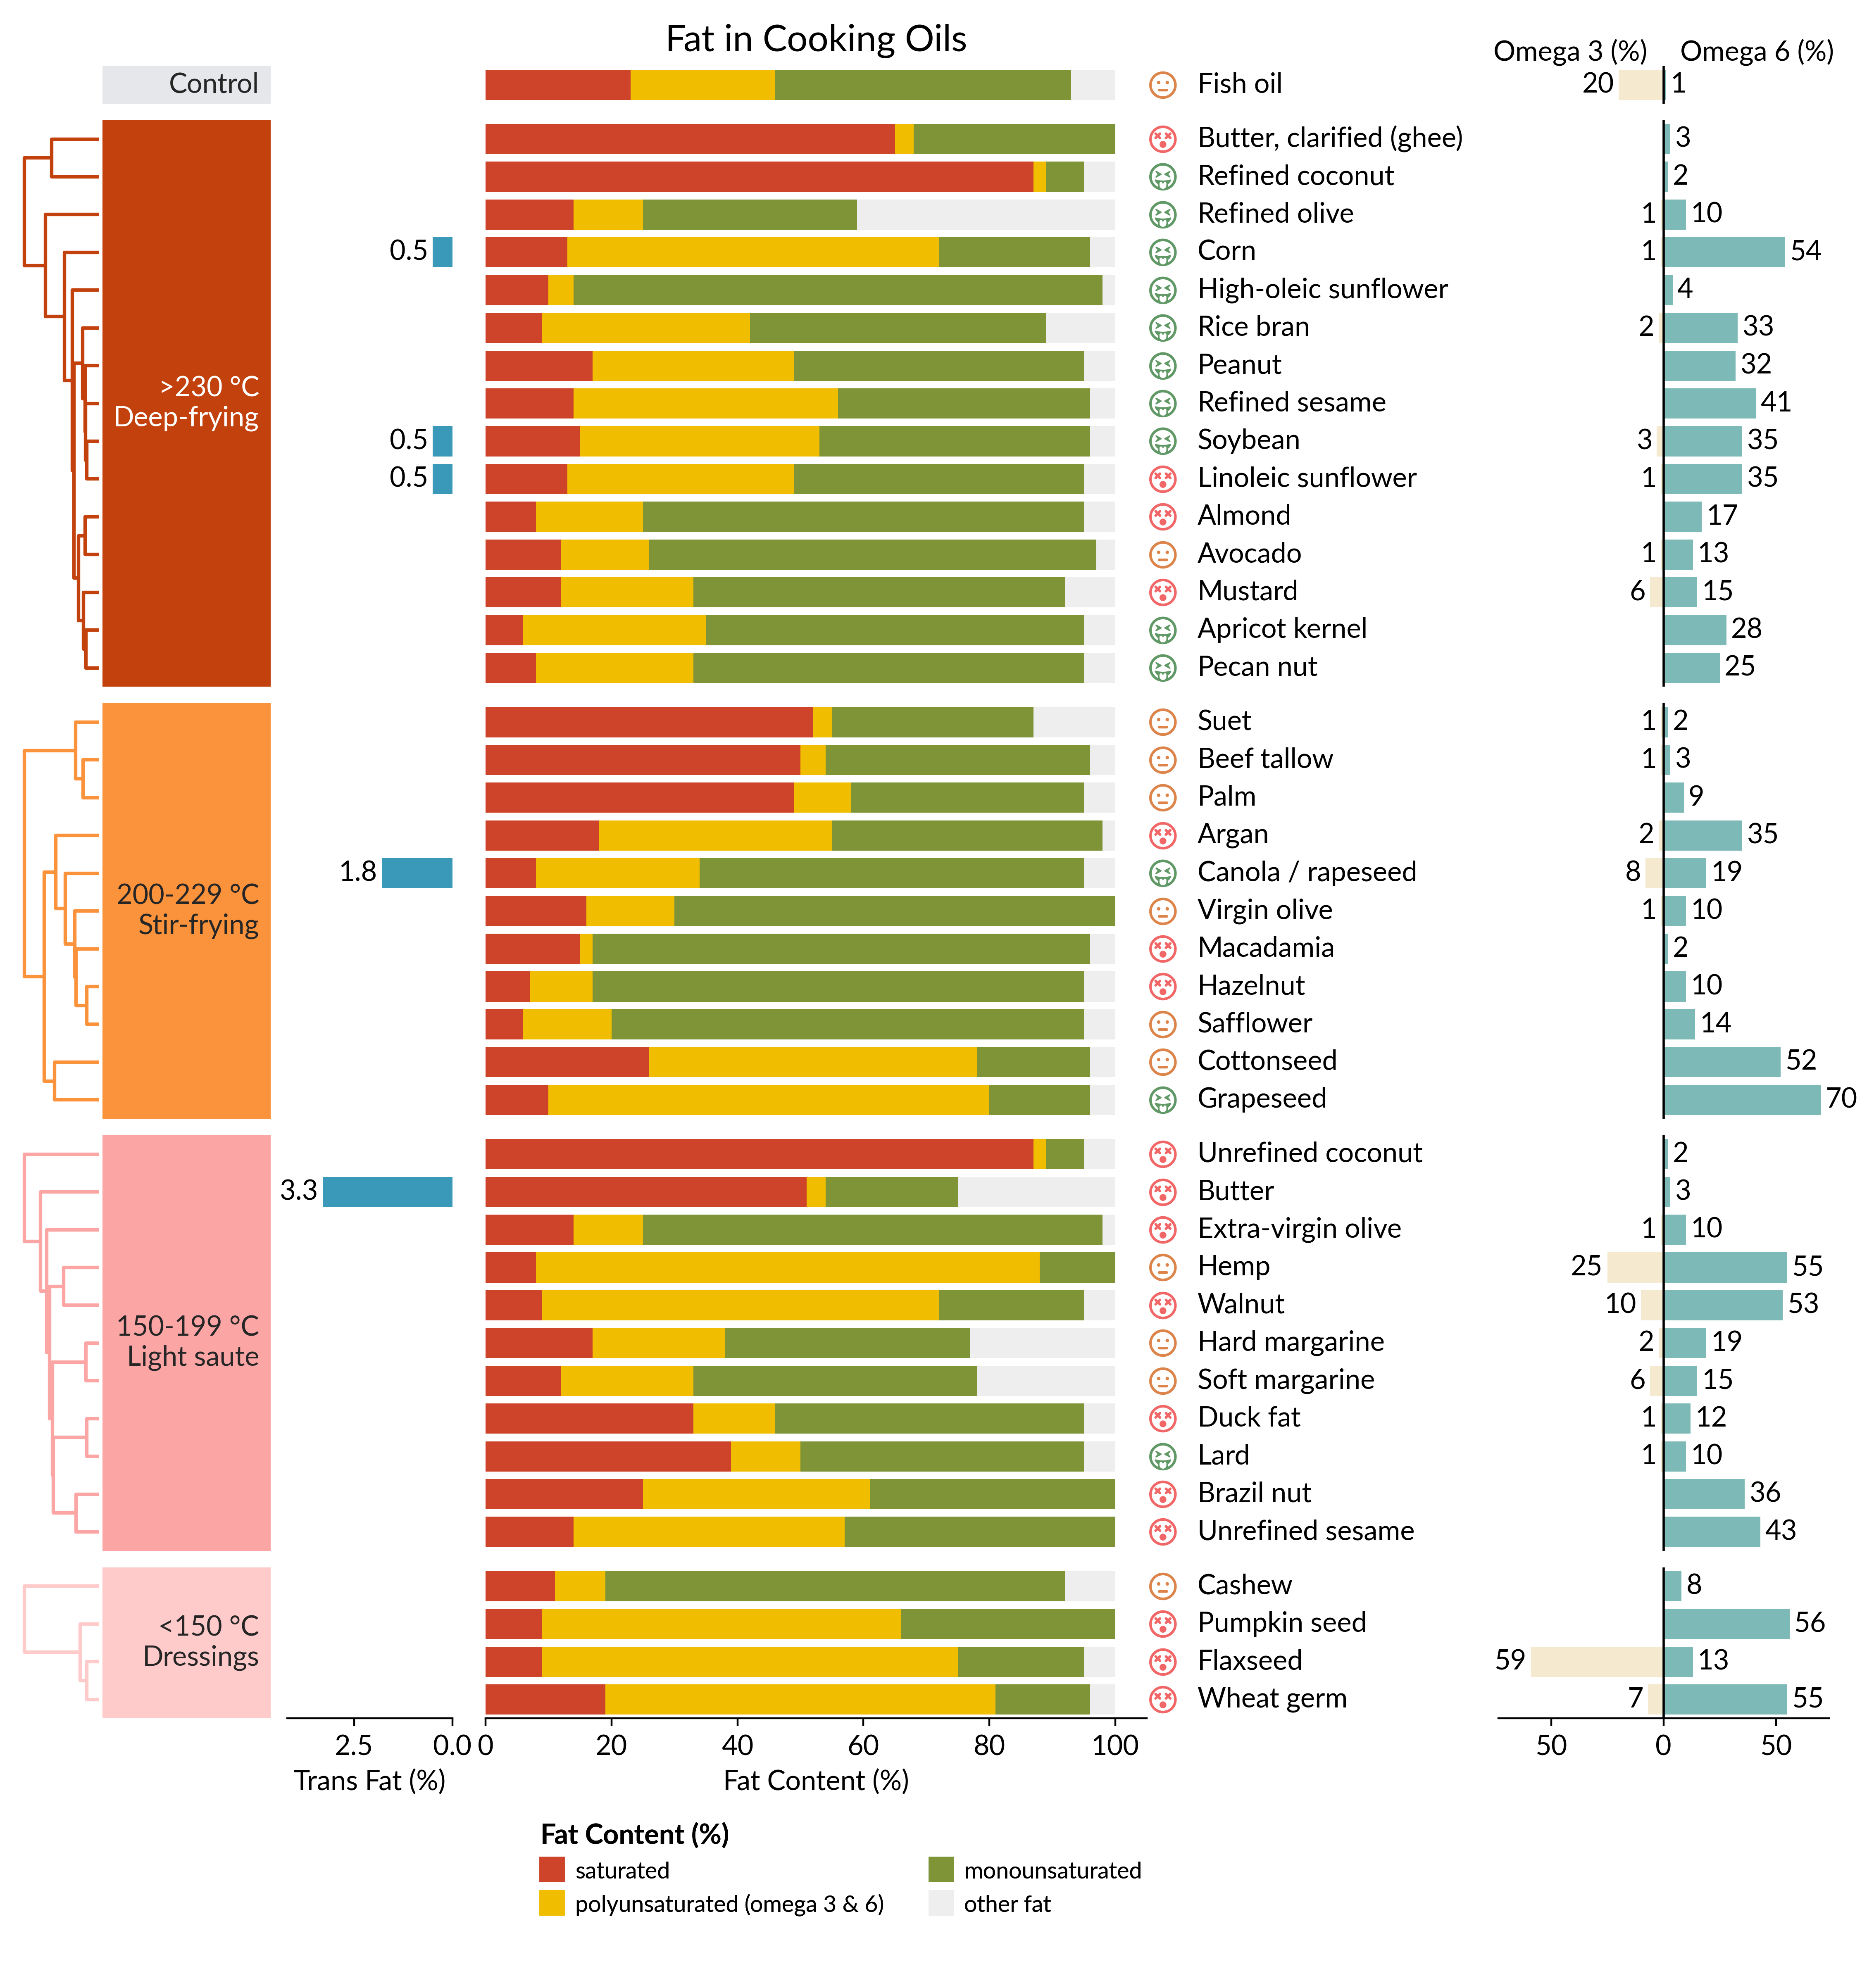
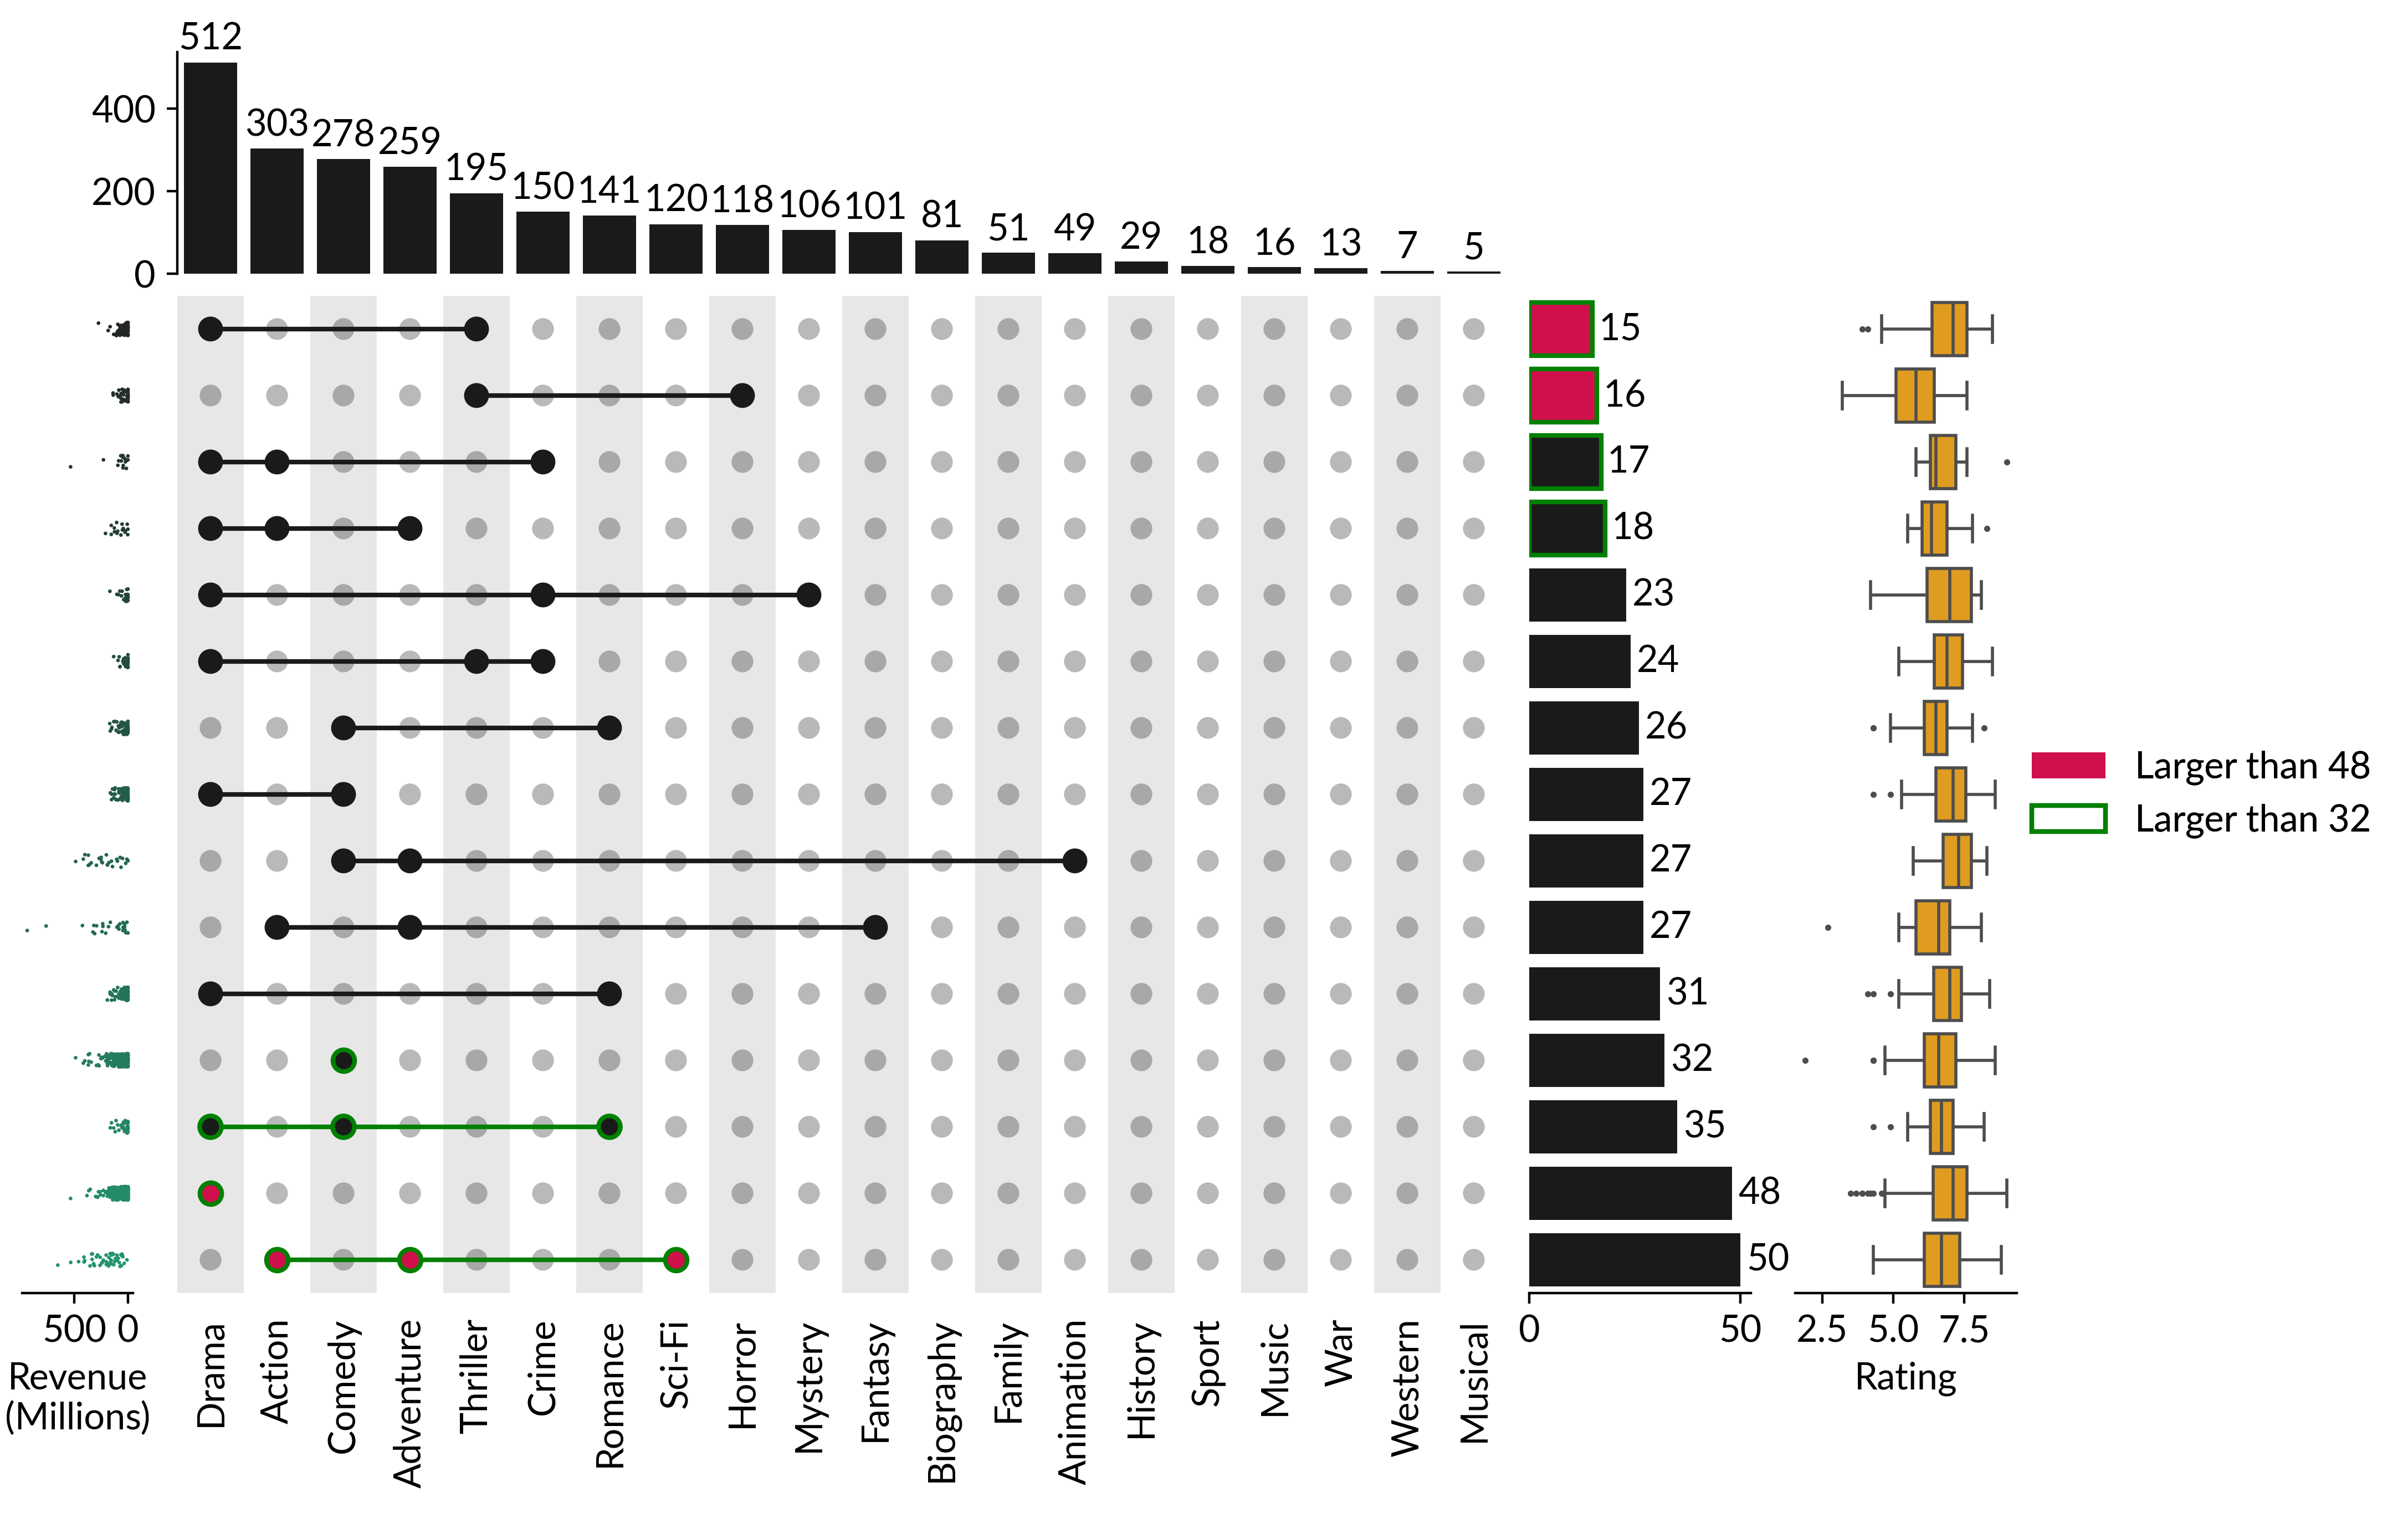
You can create more than just heatmap, other examples that are created with Marsilea:

Feel free to share the post, and spread the word, any suggestions and comments are welcomed! If you encounter any bugs, you can file an issue or submit a PR!