I am trying to make a transparent chart and have managed to make the frame area transparent using frameon(False). However I can't find out how to make the plot area background on the chart transparent, without using a graphics package to process the matplotlib produced image. I have searched the mailing list and documentation but haven't found any information on the subject.
Can anyone offer any advice?
Regards,
Richard
gca().axesPatch.set_alpha(0.0)
···
On 8/4/06, Richard House <[email protected]...> wrote:
I am trying to make a transparent chart and have managed to make the frame area transparent using frameon(False). However I can't find out how to make the plot area background on the chart transparent, without using a graphics package to process the matplotlib produced image. I have searched the mailing list and documentation but haven't found any information on the subject.
Can anyone offer any advice?
On Behalf Of Charlie Moad, Sent: 04 August 2006 13:59
I am trying to make a transparent chart and have managed to make the frame area transparent using frameon(False). However I can't find out how to make the plot area background on the chart transparent, without using a graphics package to process the matplotlib produced image. I have searched the mailing list and documentation but haven't found any information on the subject.
Can anyone offer any advice?
gca().axesPatch.set_alpha(0.0)
Thanks for that Charlie. It works, but removes the axes plot area border so the x and y axes have no solid line. Is there a simple way to avoid that or do I need to plot the axes as lines?
···
-----Original Message-----
Subject: Re: [Matplotlib-users] Making the Axes Plot Area Transparent Ratherthan having Color
On 8/4/06, Richard House <[email protected]...> wrote:
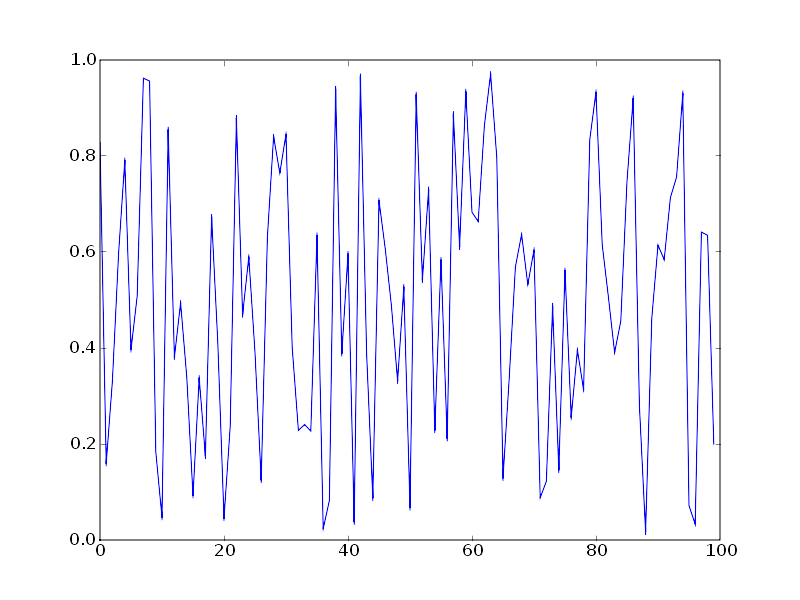
I don't think I am seeing that effect. I am attaching my output for this:
figure(frameon=False)
plot(rand(100))
gca().axesPatch.set_alpha(0.0)
savefig('out.png')
···
On 8/4/06, Richard House <[email protected]...> wrote:
-----Original Message-----
On Behalf Of Charlie Moad, Sent: 04 August 2006 13:59
Subject: Re: [Matplotlib-users] Making the Axes Plot Area Transparent Ratherthan having ColorOn 8/4/06, Richard House <[email protected]...> wrote:
> I am trying to make a transparent chart and have managed to make the frame area transparent using frameon(False). However I can't find out how to make the plot area background on the chart transparent, without using a graphics package to process the matplotlib produced image. I have searched the mailing list and documentation but haven't found any information on the subject.
> Can anyone offer any advice?gca().axesPatch.set_alpha(0.0)
Thanks for that Charlie. It works, but removes the axes plot area border so the x and y axes have no solid line. Is there a simple way to avoid that or do I need to plot the axes as lines?
On Behalf Of Charlie Moad, Sent: 04 August 2006 14:34
On Behalf Of Charlie Moad, Sent: 04 August 2006 13:59
Subject: Re: [Matplotlib-users] Making the Axes Plot Area Transparent
Ratherthan having Color> I am trying to make a transparent chart and have managed to make the frame area transparent using frameon(False). However I can't find out how to make the plot area background on the chart transparent, without using a graphics package to process the matplotlib produced image. I have searched the mailing list and documentation but haven't found any information on the subject.
> Can anyone offer any advice?gca().axesPatch.set_alpha(0.0)
Thanks for that Charlie. It works, but removes the axes plot area border so the x and y axes have no solid line. Is there a simple way to avoid that or do I need to plot the axes as lines?
I don't think I am seeing that effect. I am attaching my output for this:
figure(frameon=False)
plot(rand(100))
gca().axesPatch.set_alpha(0.0)
savefig('out.png')
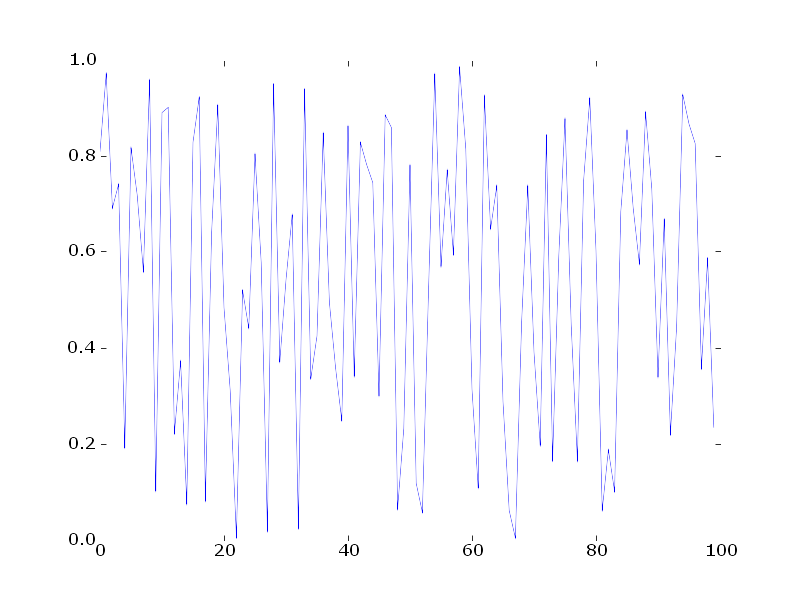
Thanks again Charlie. Just had a few experiments. I wonder if we are dealing with difference platform/version behaviour? I was running WinXP, Python 2.4, Matplotlib 0.82 and your example code did not produce transparency for me. However the following code did but without the plot area border (example attached):
#!/usr/bin/env python
from pylab import *
fig = figure()
fig.set_frameon(False)
plot(rand(100))
gca().axesPatch.set_alpha(0.0)
savefig('transparent.png')
On upgrading to 0.87.3 (0.87.4 complains about numpy versions), and running this code, the png file produced does include a border, the same as in your output sample. The upgraded matplotlib also produces a plot area border in my own chart code, so the problem is solved.
Many thanks.
···
-----Original Message-----
Subject: Re: [Matplotlib-users] Making the Axes Plot Area TransparentRatherthan having Color
On 8/4/06, Richard House <[email protected]...> wrote:
-----Original Message-----
On 8/4/06, Richard House <[email protected]...> wrote:
Sounds like you got it working then. Mpl 0.87.4 requires numpy-0.9.8.
I think 0.87.3 requires 0.9.6, but I am starting to forget all the
number combinations. Once numpy 1.0 is released, this mess should be
gone.
···
On 8/4/06, Richard House <[email protected]...> wrote:
-----Original Message-----
On Behalf Of Charlie Moad, Sent: 04 August 2006 14:34
Subject: Re: [Matplotlib-users] Making the Axes Plot Area TransparentRatherthan having ColorOn 8/4/06, Richard House <[email protected]...> wrote:
> -----Original Message-----
> On Behalf Of Charlie Moad, Sent: 04 August 2006 13:59
> Subject: Re: [Matplotlib-users] Making the Axes Plot Area Transparent
> Ratherthan having Color
>
> On 8/4/06, Richard House <[email protected]...> wrote:
> > I am trying to make a transparent chart and have managed to make the frame area transparent using frameon(False). However I can't find out how to make the plot area background on the chart transparent, without using a graphics package to process the matplotlib produced image. I have searched the mailing list and documentation but haven't found any information on the subject.
> > Can anyone offer any advice?
>
> gca().axesPatch.set_alpha(0.0)
>
> Thanks for that Charlie. It works, but removes the axes plot area border so the x and y axes have no solid line. Is there a simple way to avoid that or do I need to plot the axes as lines?I don't think I am seeing that effect. I am attaching my output for this:
figure(frameon=False)
plot(rand(100))
gca().axesPatch.set_alpha(0.0)
savefig('out.png')Thanks again Charlie. Just had a few experiments. I wonder if we are dealing with difference platform/version behaviour? I was running WinXP, Python 2.4, Matplotlib 0.82 and your example code did not produce transparency for me. However the following code did but without the plot area border (example attached):
#!/usr/bin/env python
from pylab import *
fig = figure()
fig.set_frameon(False)
plot(rand(100))
gca().axesPatch.set_alpha(0.0)
savefig('transparent.png')On upgrading to 0.87.3 (0.87.4 complains about numpy versions), and running this code, the png file produced does include a border, the same as in your output sample. The upgraded matplotlib also produces a plot area border in my own chart code, so the problem is solved.