probably this is quite stupid.
cheers,
Chao
On Wed, May 22, 2013 at 1:03 PM, Martin Mokrejs [via matplotlib] <[hidden email] </user/SendEmail.jtp?type=node&node=41105&i=0>> wrote:
Hi Chao,
ChaoYue wrote:
> Dear Martin,
>
> I worked out a similar example for your reference as I don't catch your example very well.
I think you got the idea quite well.
>
> fig = plt.figure()
> ax1 = fig.add_subplot(211)
> ax2 = fig.add_subplot(212)
> arrlist = [np.random.normal(size=100) for i in range(50)]
> ret = ax1.hist(arrlist,histtype='barstacked')
> reclist = [patchlist[0] for patchlist in ret[2]]
> labellist = ['data'+str(i) for i in range(50)]
> ax2.legend(reclist,labellist,loc='upper left',bbox_to_anchor=(0,0,1,1),borderaxespad=0.,ncol=5,mode='expand')
> ax2.set_frame_on(False)
> ax2.tick_params(bottom='off',left='off',right='off',top='off')
> plt.setp(ax2.get_yticklabels(),visible=False)
> plt.setp(ax2.get_xticklabels(),visible=False)
>
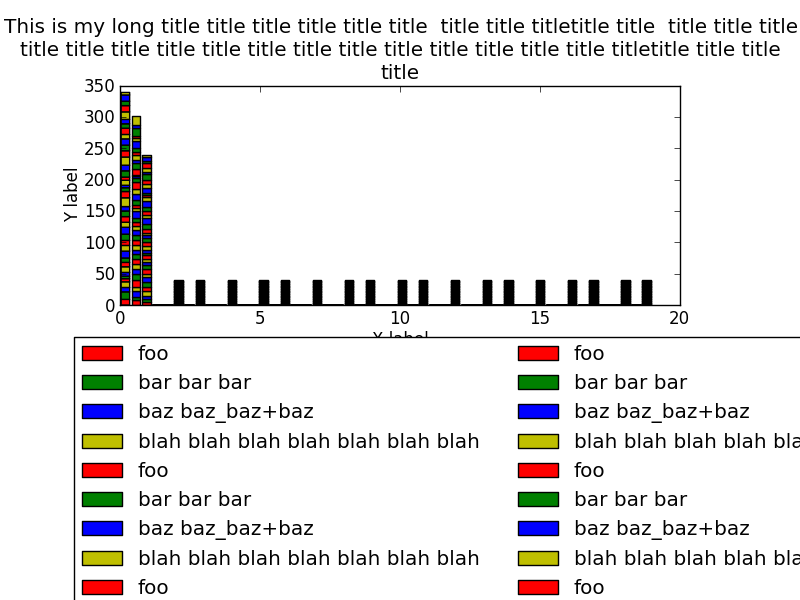
I added plt.show() and it demonstrates my problem: the legend is not complete in the
figure. That is why I think I could instead use:
import pylab as plt
import numpy as np
fig = plt.figure()
DefaultSize = tuple(fig.get_size_inches())
fig.set_size_inches(DefaultSize[0], 4*DefaultSize[1])
ax1 = fig.add_subplot(411)
ax2 = fig.add_subplot(412)
arrlist = [np.random.normal(size=100) for i in range(50)]
ret = ax1.hist(arrlist,histtype='barstacked')
reclist = [patchlist[0] for patchlist in ret[2]]
labellist = ['data'+str(i) for i in range(50)]
ax2.legend(reclist,labellist,loc='upper left',bbox_to_anchor=(0,0,1,1),borderaxespad=0.,ncol=5,mode='expand')
ax2.set_frame_on(False)
ax2.tick_params(bottom='off',left='off',right='off',top='off')
plt.setp(ax2.get_yticklabels(),visible=False)
plt.setp(ax2.get_xticklabels(),visible=False)
plt.show()
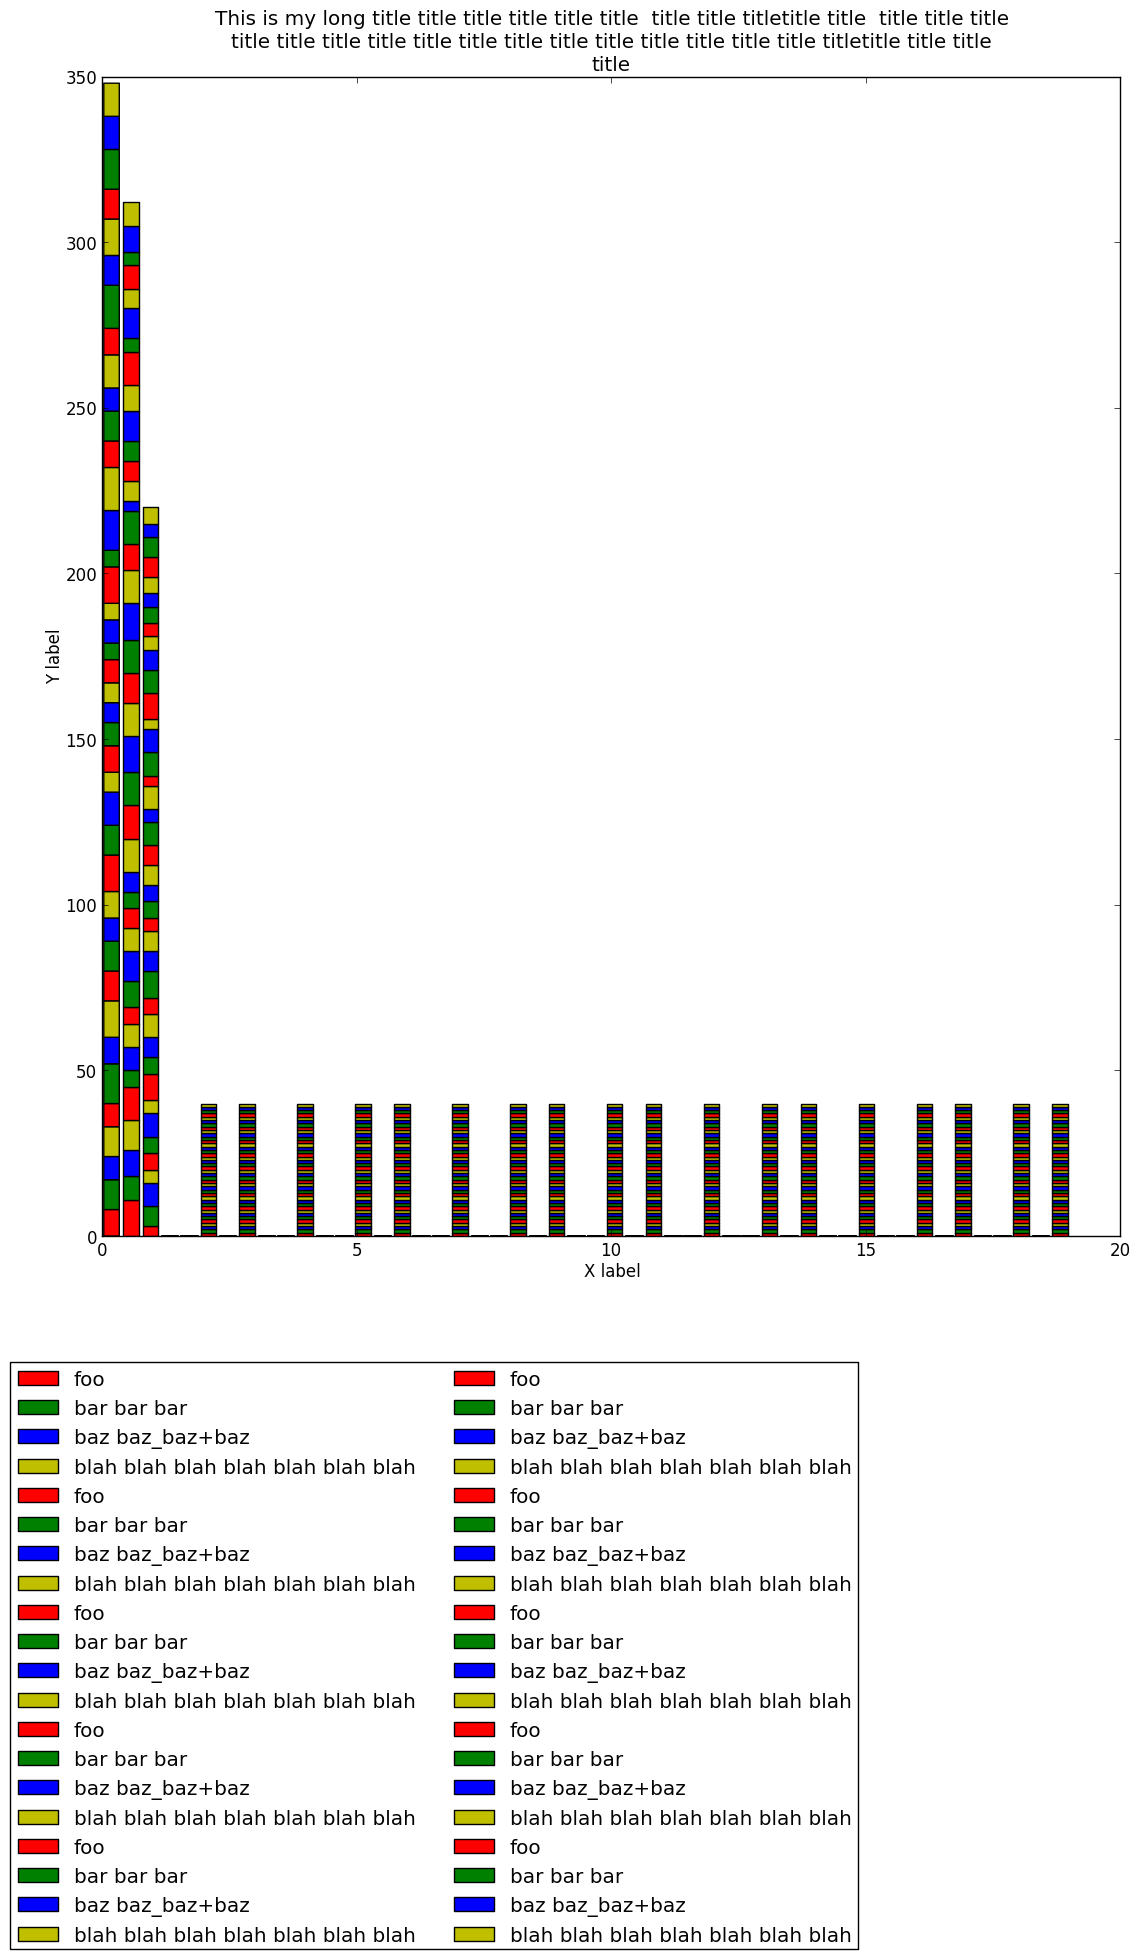
But, this does not make the image 4* taller than I thought. But thank you
for the example how to extract the legend of ax1 and place it under ax2.
>
> you're asking some object-oriented way, I personally don't think
> using pylab and set_tight_layout are the good way to be
> "object-oriented" as pylab is only a bounding wrapper by my
> understanding (maybe I am wrong!). legend and hist are all
> matplotlib.axes.Axes method.
>
> Also, I think it's unrealistic to ask the figure do a nice job for
> you if there are 50 legend handlers and you want to show them in 2
> columns with a very high width/height ratio of the figure....
The problem is that the data are calculated dynamically and sometimes
I need to display data for 20 data types while sometimes for 200 data
types (and for each I need a legend).
I did not show that but I do calculate how many columns I could use
legend display and pass that via pylab.legend(..., ncol= ). Of course
at the same time I could calculate whether I will need 2 or 3 or 4
subplots on the page (the first will be the barchart itself), the
remaining space will be used by the long legend of subplot(211).
I would hope that matplotlib does not mind that I actually issue any
fig.add_subplot() foe the third or even fourth subplot at all. That
would be just a trick to get more space for the legend. If I can live
with just with subplot(211) and subplot(212)
The fig.savefig('foobar.png', bbox_inches='tight') which Ben mentioned
yesterday is nice but I want it to crop the image only vertically.
An optional argument like:
fig.savefig('foobar.png', bbox_inches='tight', keep_fig_width=True)
would maybe do the job for me.
What I still don't understand what is resizing the image in tight_layout.
It doesn't seem to me that just the unused border space is chopped away.
Fonts look different, ratio between x and y axes lengths seems different.
Certainly not what I want.
> hope it could be of a bit help,
Sure, I am still learning to use matplotlib.
Martin
>
> cheers,
>
> Chao
>
>
> On Mon, May 20, 2013 at 6:43 PM, Martin Mokrejs [via matplotlib] <[hidden email] </user/SendEmail.jtp?type=node&node=41102&i=0>> wrote:
>
> Hi Ben,
>
> Benjamin Root wrote:
>
> >
> >
> >
> > On Mon, May 20, 2013 at 12:02 PM, Martin Mokrejs <[hidden email] <http://user/SendEmail.jtp?type=node&node=41090&i=0> <mailto:[hidden email] <http://user/SendEmail.jtp?type=node&node=41090&i=1>>> wrote:
> >
> > Hi,
> > I am having trouble to get space allocated for a long legend text,
> > lets say spanning 2/3 - 3/4 of the whole output. I would like to have
> > stacked barchart as 1st subplot and the place of remaining 3 subplots
> > to be actually allocated by the legend. Alternatively, could I get the
> > legend saved into a separate figure?
> >
> > Or could the space for legend text be allocated automatically minimizing
> > output figure size? For example, the width would be 1120px while height
> > be multiples of 840px (840 for each subplot)?
> >
> > Attached is a quick example. It shows also that I tried tight_layout()
> > but wasn't successful with this either. I would be glad for some help,
> > ideally converting the whole thing into an object-oriented approach.
> > I am generating several figures in a row and would like to clear()/del()
> > any previously used data ASAP.
> >
> >
> > Thank you,
> > Martin
> > Am using mpl-1.2.2
> >
> >
> > Try "fig.savefig('foobar.png', bbox_inches='tight')" when saving the
> > image. It will make the figure size such that all the visible
> > elements of the figure will fit into the saved output. tight_layout()
> > is meant to make sure the elements don't overlap each other, but does
> > nothing about making sure nothing gets clipped.
> Ah, would be nice to make this clear in the docs. So far was doing
>
>
> import pylab
> F = pylab.gcf()
> F.set_tight_layout(True)
>
> which as you say does not help the way I thought.
>
>
> Unfortunately, while
>
> fig.savefig('foobar.png', bbox_inches='tight')
>
> helped to get everything into the .png file (attached), the barchart itself
> should span according to the code I posted just 1/2 of the figure. But somehow
> it is enlarged and rescaled so that it occupies *more than* 1/2 of the figure.
> What in pylab is resizing my image? Note: the final image is 625x1075.
>
> Martin