Currently, a user could programatically change subplot layouts using plt.tight_layout()
or plt.rcParams['figure.constrained_layout.use'] = True
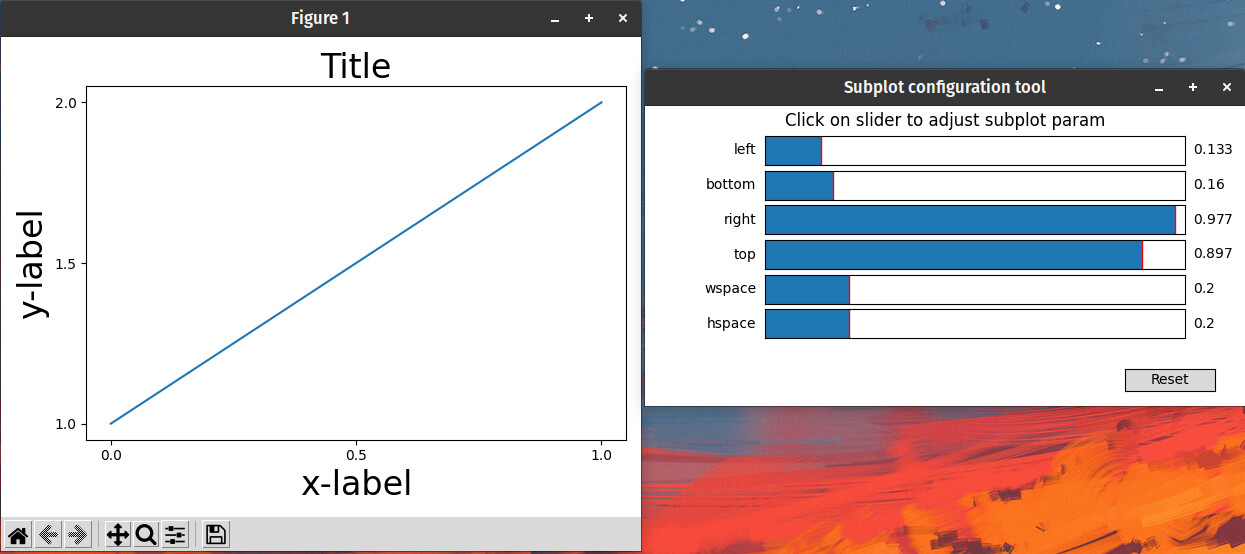
Matplotlib allows things to be dynamic after window is deployed, by letting a user configure subplots using the Subplot configuration tool - where one could edit parameters like the ones in the image below.
Proposal:
Add a slider with discrete steps which would change the plot using tight_layout, etc.
Alternate Proposal:
Slider with continuous steps, which would shrink/expand the distance between artists.
You don’t have many knobs to twiddle. Basically just w/hspace and for constrained_layout w/hpad. I’m sure you could make a slider for those if really wanted.
I’m personally somewhat skeptical about fiddly tools like this because they are not reproducible, but I guess if they get you to somewhere aesthetically pleasing and you then save in your script, they could be useful.
I guess if they get you to somewhere aesthetically pleasing and you then save in your script, they could be useful.
So it would mean that first get a metric which looks good using this tool, and then a change to the API , something like plt.tight_layout(metric)?