Hi everybody,
I have questions:
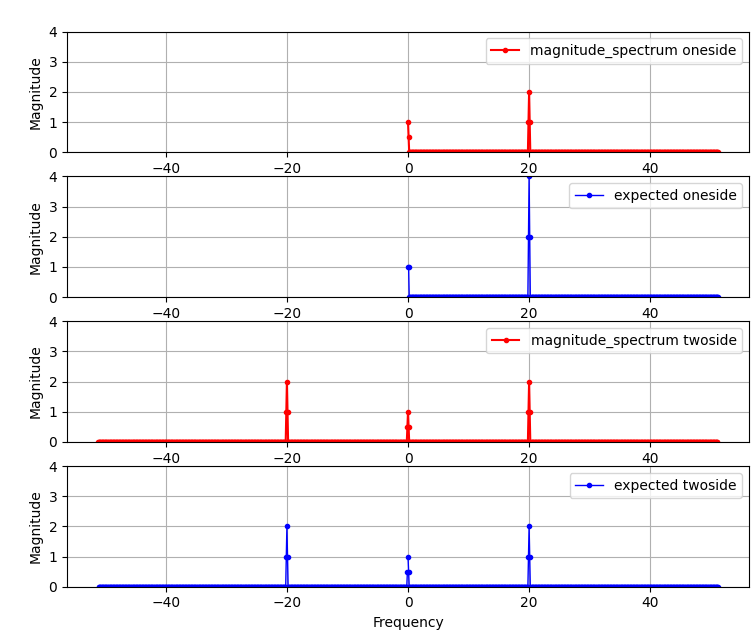
One about the scaling of a oneside magnitude_spectrum using the magnitude_spectrum function and another about the representation of the Nyquist frequency at the twoside magnitude_spectrum. According to the post
I would expect that the magnitudes of the oneside spectrums are double the size of the two side spectrum (except origin and Nyquist) and are therefore directly comparable to the amplitude of the source sin.
And for the Nyuist frequence of an even underlaying FFT, why is it shift to the positive side at the oneside magnitude_spectrum and is left on the negative side at the twoside magnitude_spectrum?
I wrote that script in Python (based on scypi, numpy and matplotlib) two show the deviations to my expectations (Sample frequency is 102,4Hz and therefore Nyquist is 51.2):
import numpy as np
import matplotlib.pyplot as plt
from scipy import signal

tau, n = 10, (2**10)  # 10 second signal with 1024 points
T = tau/n  # sampling interval

lenOneSideFFTEven = n//2 + 1

t = np.arange(n)*T
x = 4*np.sin(40*np.pi*t)+1  # 20 Hz sine, with amplidute of 4 and a DC offset of 1
w = signal.windows.hann(n, False)

f = np.fft.fftfreq(n, T)  # frequency slots
df = f[1] - f[0]
X = np.fft.fft(x*w)/w.sum()  # Windowed FFT scaled to amplitude
MagTwoSide = np.abs(X)
MagOneSide = np.copy(MagTwoSide[:lenOneSideFFTEven])
MagOneSide[1:] = MagOneSide[1:] * 2.0
f[lenOneSideFFTEven-1] *= -1

# shift for plotting:
plt.figure()
plt.clf()
plt.title("FFT of 20Hz Sin's + DC offset 1")
ax1 = plt.subplot(411)
plt.magnitude_spectrum(x, Fs=1/T, sides='onesided', color="red", marker='.', scale='linear', label="magnitude_spectrum oneside")
plt.ylabel('Magnitude')
plt.xlabel('Frequency')
plt.ylim(0, 4)
plt.legend()
plt.grid(True)
plt.subplot(412, sharex=ax1)
plt.plot(f[:lenOneSideFFTEven], MagOneSide, 'b.-', linewidth=1, label='expected oneside')
plt.ylabel('Magnitude')
plt.xlabel('Frequency')
plt.ylim(0, 4)
plt.legend()
plt.grid(True)
plt.subplot(413, sharex=ax1)
plt.magnitude_spectrum(x, Fs=1/T, sides='twosided', color="red", marker='.', scale='linear', label="magnitude_spectrum twoside")
plt.ylabel('Magnitude')
plt.xlabel('Frequency')
plt.ylim(0, 4)
plt.legend()
plt.grid(True)
plt.subplot(414, sharex=ax1)
plt.plot(f, MagTwoSide, 'b.-', linewidth=1, label='expected twoside')
plt.ylabel('Magnitude')
plt.xlabel('Frequency')
plt.ylim(0, 4)
plt.legend()
plt.grid(True)

plt.show(block='false')
Thank you in advance
ps