Hi everybody,
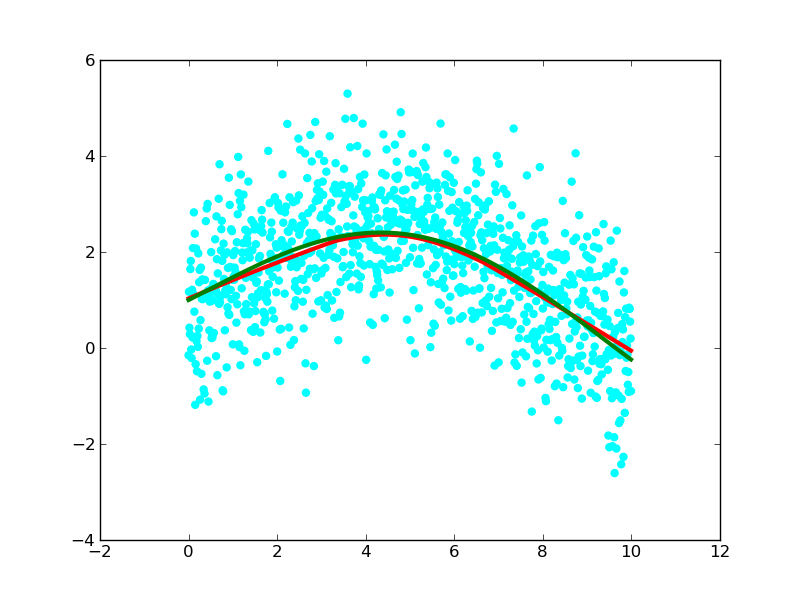
A number of years ago I wrote a function to do Lowess smoothing to calculate a smooth curve through a scatter plot. I copied an example script below and attached the resulting figure to this mail.
I think that such a smoothing function would be a useful addition to matplotlib. Does anybody have any objections against me adding this to matplotlib? If not, what would be a suitable place to put this function?
--Michiel.
from pylab import *
x = arange(0,10,0.01)
ytrue = exp(-x/5.0) + 2*sin(x/3.0)
# add random errors with a normal distribution
y = ytrue + normal(size=len(x))
scatter(x,y,color='cyan')
# calculate a smooth curve through the scatter plot
ys = smooth(x, y, 'lowess')
plot(x,ys,'red',linewidth=3)
# draw the true values for comparison
plot(x,ytrue,'green',linewidth=3)
I’m not a matplotlib developer, but smoothing seems more appropriate for scipy. There’s been some talk of starting a scikit for smoothing functions (see links below), but I’m not sure if anyone has the motivation to actually take the lead.
-Tony
http://mail.scipy.org/pipermail/scipy-user/2010-February/024402.html
http://mail.scipy.org/pipermail/scipy-user/2010-February/024408.html
···
On Apr 24, 2010, at 4:25 AM, Michiel de Hoon wrote:
Hi everybody,
A number of years ago I wrote a function to do Lowess smoothing to calculate a smooth curve through a scatter plot. I copied an example script below and attached the resulting figure to this mail.
I think that such a smoothing function would be a useful addition to matplotlib. Does anybody have any objections against me adding this to matplotlib? If not, what would be a suitable place to put this function?
Michiel de Hoon wrote:
Hi everybody,
A number of years ago I wrote a function to do Lowess smoothing to calculate a smooth curve through a scatter plot. I copied an example script below and attached the resulting figure to this mail.
I think that such a smoothing function would be a useful addition to matplotlib. Does anybody have any objections against me adding this to matplotlib? If not, what would be a suitable place to put this function?
--Michiel.
Michiel,
Certainly it would be good to have that function available, but I'm not in favor of putting it in mpl. The trend has been to try to reduce overlap among mpl, numpy, and scipy. To that end, scipy seems like the natural home for smoothing functions.
Eric
···
from pylab import *
x = arange(0,10,0.01)
ytrue = exp(-x/5.0) + 2*sin(x/3.0)
# add random errors with a normal distribution y = ytrue + normal(size=len(x))
scatter(x,y,color='cyan')
# calculate a smooth curve through the scatter plot
ys = smooth(x, y, 'lowess')
plot(x,ys,'red',linewidth=3)
# draw the true values for comparison
plot(x,ytrue,'green',linewidth=3)
------------------------------------------------------------------------
------------------------------------------------------------------------
------------------------------------------------------------------------------
------------------------------------------------------------------------
_______________________________________________
Matplotlib-devel mailing list
[email protected]
matplotlib-devel List Signup and Options
Eric, Tony, thanks for your replies. I'll look at SciPy then for this functionality.
Thanks,
--Michiel.
···
--- On Sat, 4/24/10, Eric Firing <[email protected]...> wrote:
From: Eric Firing <[email protected]...>
Subject: Re: [matplotlib-devel] Lowess smoothing
To: "Michiel de Hoon" <[email protected]...>
Cc: [email protected]
Date: Saturday, April 24, 2010, 2:29 PM
Michiel de Hoon wrote:
> Hi everybody,
>
> A number of years ago I wrote a function to do Lowess
smoothing to calculate a smooth curve through a scatter
plot. I copied an example script below and attached the
resulting figure to this mail.
> I think that such a smoothing function would be a
useful addition to matplotlib. Does anybody have any
objections against me adding this to matplotlib? If not,
what would be a suitable place to put this function?
>
> --Michiel.
>
Michiel,
Certainly it would be good to have that function available,
but I'm not in favor of putting it in mpl. The trend
has been to try to reduce overlap among mpl, numpy, and
scipy. To that end, scipy seems like the natural home
for smoothing functions.
Eric
>
> from pylab import *
>
> x = arange(0,10,0.01)
> ytrue = exp(-x/5.0) + 2*sin(x/3.0)
>
> # add random errors with a normal distribution
y = ytrue \+ normal\(size=len\(x\)\)
> scatter(x,y,color='cyan')
>
> # calculate a smooth curve through the scatter plot
> ys = smooth(x, y, 'lowess')
> plot(x,ys,'red',linewidth=3)
>
> # draw the true values for comparison
> plot(x,ytrue,'green',linewidth=3)
>
>
>
>
>
------------------------------------------------------------------------
>
>
>
------------------------------------------------------------------------
>
>
------------------------------------------------------------------------------
>
>
>
------------------------------------------------------------------------
>
> _______________________________________________
> Matplotlib-devel mailing list
> [email protected]
> matplotlib-devel List Signup and Options