The following plot is the Fig. 5(a) and 5(b) represented in https://arxiv.org/pdf/2105.07640.pdf:
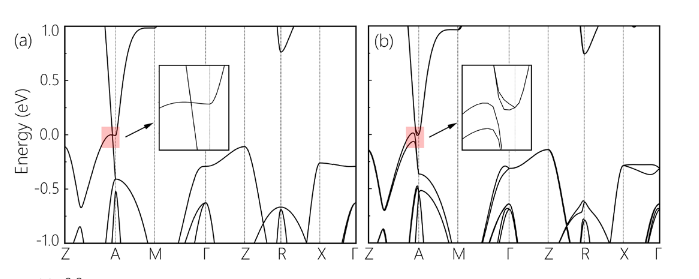
As you can see, it uses a locally zoomed in subplot sampling, which displayed as a superposition on the original one. How to create a plot like this with matplotlib?
Any hints will be highly appreciated.
Regards,
HY