Hello,
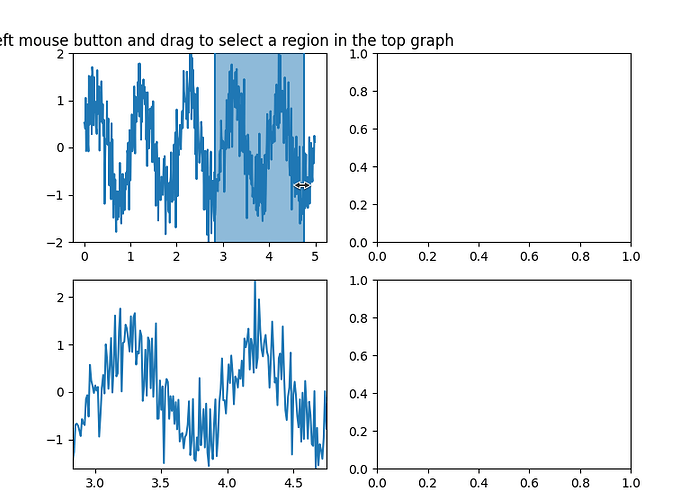
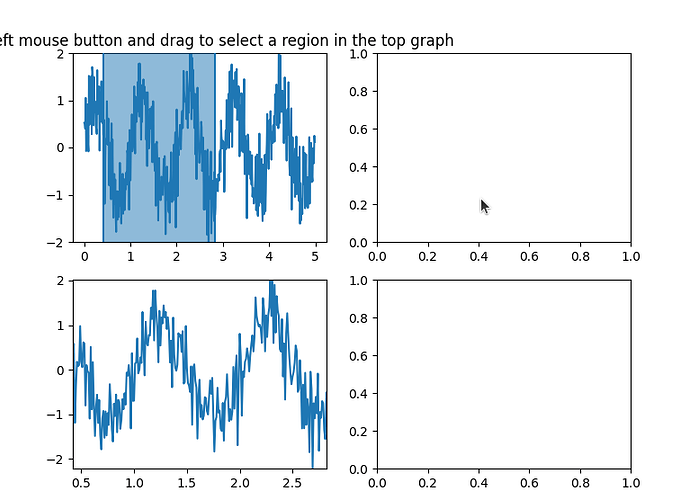
If you consider the example given for the SpanSelector here and add one (or more) axes on the right side, the span selection on the first axes now “wraps” around when the mouse exit the first axes and goes onto the axes on the right side.
Edited example to add axes on the side:
import numpy as np
import matplotlib.pyplot as plt
from matplotlib.widgets import SpanSelector

# Fixing random state for reproducibility
np.random.seed(19680801)

fig, ax = plt.subplots(2, 2, figsize=(8, 6))
ax1 = ax[0, 0]
ax2 = ax[1, 0]

x = np.arange(0.0, 5.0, 0.01)
y = np.sin(2 * np.pi * x) + 0.5 * np.random.randn(len(x))

ax1.plot(x, y)
ax1.set_ylim(-2, 2)
ax1.set_title('Press left mouse button and drag '
              'to select a region in the top graph')

line2, = ax2.plot([], [])


def onselect(xmin, xmax):
    indmin, indmax = np.searchsorted(x, (xmin, xmax))
    indmax = min(len(x) - 1, indmax)

    region_x = x[indmin:indmax]
    region_y = y[indmin:indmax]

    if len(region_x) >= 2:
        line2.set_data(region_x, region_y)
        ax2.set_xlim(region_x[0], region_x[-1])
        ax2.set_ylim(region_y.min(), region_y.max())
        fig.canvas.draw_idle()


span = SpanSelector(
    ax1,
    onselect,
    "horizontal",
    useblit=True,
    props=dict(alpha=0.5, facecolor="tab:blue"),
    interactive=True,
    drag_from_anywhere=True
)
# Set useblit=True on most backends for enhanced performance.


plt.show()
Sadly new users can now upload attachments, thus I can not upload a screencast of the issue. To reproduce, start to create a span on the top left axes, and keep dragging into the top right axes.
How can I limit the selection only to the top left axis, i.e. if I exit on the right side, then the span would clip the right side of the axes (x=5-ish) and not wrap around back to the left side.
Thanks!
Mathieu

