I just did a fresh svn checkout and my legends are no longer in the
front. The following lines produce the attached plot:
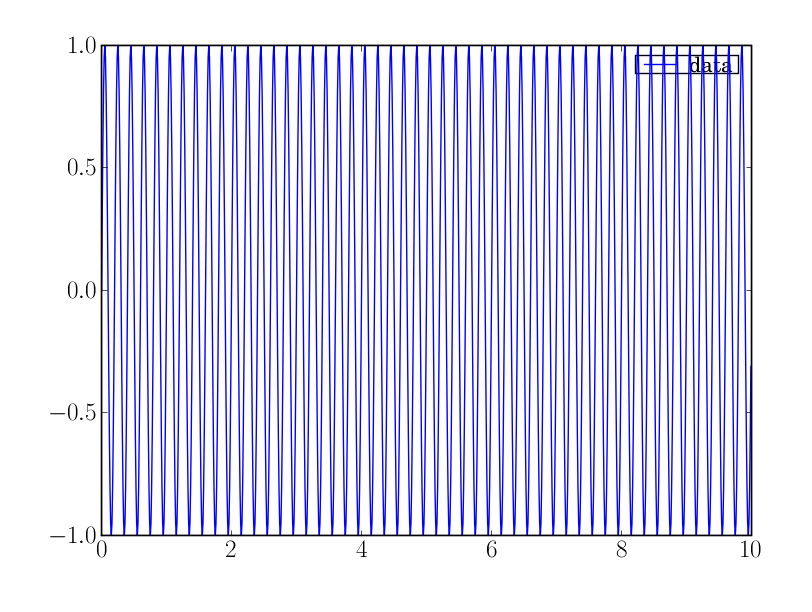
t=arange(0,10,0.01)
y=sin(2*pi*5.0*t)
plot(t,y)
legend(['data'])
Ryan
I just did a fresh svn checkout and my legends are no longer in the
front. The following lines produce the attached plot:
t=arange(0,10,0.01)
y=sin(2*pi*5.0*t)
plot(t,y)
legend(['data'])
Ryan