How do I get the final “180” tick label to show up on my plots on the far right of my x axis (or top of the y axis).
When I do: print ax.xaxis.get_majorticklocs() it returns:
[ 0. 20. 40. 60. 80. 100. 120.]
and I have a label for each of those locations:
ax.xaxis.set_ticklabels([“-180”, “-120”, “-60”, “0”, “60”, “120”, “180”])
For some reason the final “180” tick label doesn’t display.
Thanks,
Erik Thompson
Hello Erik,
I can reproduce your problem (mpl 0.98.6svn) with the following little
example:
import matplotlib.pyplot as plt
ax = plt.axes()
ax.set_xlim((0.0, .9999))
print ax.xaxis.get_majorticklocs()
plt.show()
where the last tick is out of the xlimits. Could this be the case for your
example, too?
Nevertheless the question still would be: Is this a bug in the handling of
xticks and their corresponding labels?
best regards Matthias
···
On Wednesday 29 April 2009 18:07:17 Erik Thompson wrote:
How do I get the final "180" tick label to show up on my plots on the far
right of my x axis (or top of the y axis).
When I do: print ax.xaxis.get_majorticklocs() it returns:
[ 0. 20. 40. 60. 80. 100. 120.]
and I have a label for each of those locations:
ax.xaxis.set_ticklabels(["-180", "-120", "-60", "0", "60", "120", "180"])
For some reason the final "180" tick label doesn't display.
Thanks,
Erik Thompson
get_majorticklocs (and similar methods) does not return the locations
of the ticks that will be plotted. It simply returns the tick values
generated by the locator instance. And among them, only those within
the axis limits will be drawn. My guess is that this was a design
decision, not a bug.
The following is a related post which includes some code snippets that
can be used to retrieve tick locations inside the axis limits.
http://www.nabble.com/eliminating-the-top-tick-on-an-axis-to19446256.html#a19446256
Regards,
-JJ
···
On Wed, Apr 29, 2009 at 12:21 PM, Matthias Michler <[email protected]...> wrote:
where the last tick is out of the xlimits. Could this be the case for your
example, too?
Nevertheless the question still would be: Is this a bug in the handling of
xticks and their corresponding labels?
Matthias,
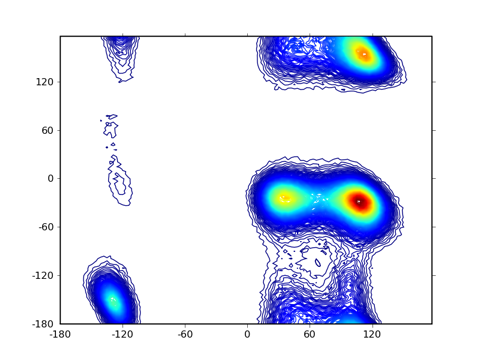
Thanks for your help. When I did ax.set_xlim((0.0, 120.0)) the 180 tick showed up although ugly on some plots because there was missing data at the 180 degrees mark.
I then copied all the datapoints from the -180 degrees into new 180 degree data points (they are the supposed to be the same) and everything works well now.
Erik Thompson