I am plotting up to 12 curves and plot one them last to have it on top of all others to emphasize visibility. 8 of the curves go on the left-Y axis, the other 4 on the right-Y axis. All works, except:
When only the left curves are plotted, the last does go on top. Likewise, when only right curves are plotted.
However, when both left and right curves are plotted, then the right curves cover all left curves, even if one of them is plotted last, and thus it is NOT visible on top!
I believe this had worked before. Is there anything I am missing?
I am using matplotlib 3.83 with backend Qt5Agg on Linux Mint 21.2
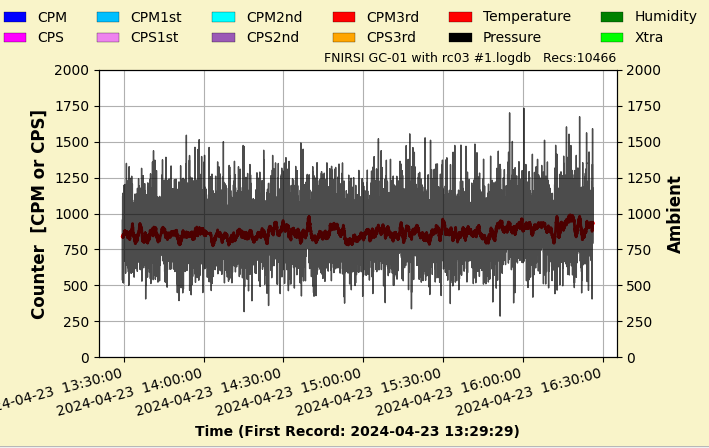
As an example, this ghosty line in the middle is plotted in bright-red and after the black curve is plotted, yet it is barely visible because it is covered by the black scatter.