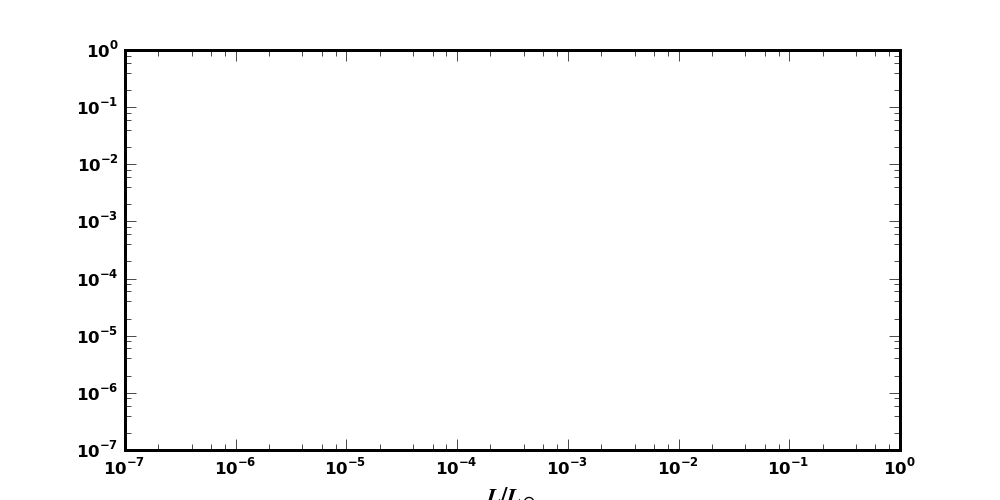
I've been grappling with an annoying bug for a while now - attached
are two examples of an empty set of log-log axes with an xlabel. one
has figsize(10,5) and the other is figsize(10,6) . As is apparent
from the images, the (10,5) figure has the xlabel cut off because the
log axes are too big. If I don't use a log axis, everything is fine,
but the added size of the superscript in the axis pushes the label off
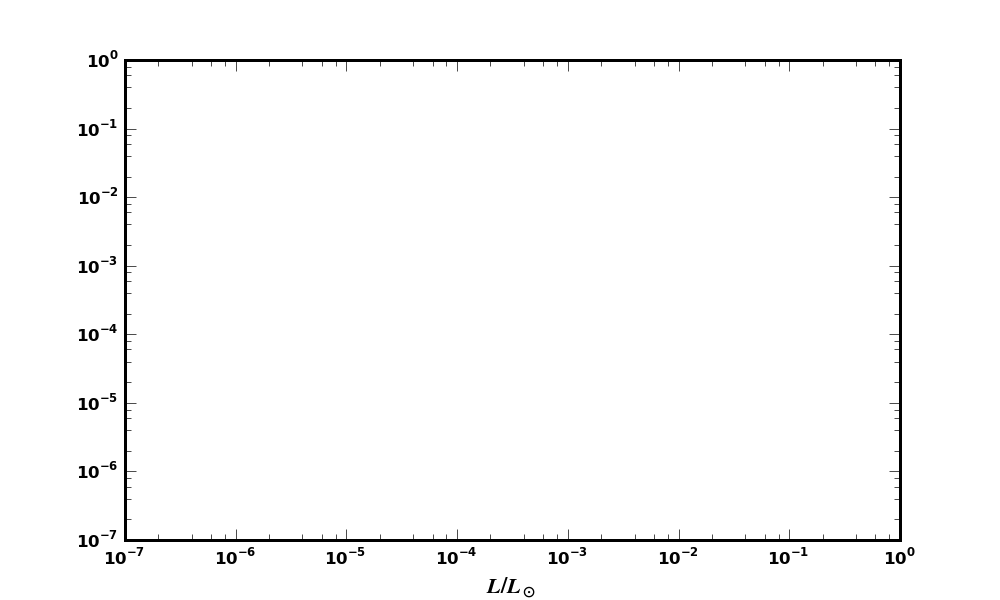
the edge of the figure. I've been working around this by changing the
size of the figure (as shown in the (10,6) figure , but sometimes I
have strict limits on the size I need for my figures. Is there an
obvious work-around to fix this, or does some of the labelling code
need to be changed? Note that this problem is much exacerbated if I
use larger font sizes or smaller figures...
···
--
Erik Tollerud
Graduate Student
Center For Cosmology
Department of Physics and Astronomy
2142 Frederick Reines Hall
University of California, Irvine
Office Phone: (949)824-2587
Cell: (651)307-9409
etolleru@...2143...
Erik Tollerud wrote:
I've been grappling with an annoying bug for a while now - attached
are two examples of an empty set of log-log axes with an xlabel. one
has figsize(10,5) and the other is figsize(10,6) . As is apparent
from the images, the (10,5) figure has the xlabel cut off because the
log axes are too big. If I don't use a log axis, everything is fine,
but the added size of the superscript in the axis pushes the label off
the edge of the figure. I've been working around this by changing the
size of the figure (as shown in the (10,6) figure , but sometimes I
have strict limits on the size I need for my figures. Is there an
obvious work-around to fix this, or does some of the labelling code
need to be changed? Note that this problem is much exacerbated if I
use larger font sizes or smaller figures...
Erik,
Instead of changing the figure size, you can use the pyplot subplots_adjust() function or the Figure.subplots_adjust() method to change the axes size and positioning within the figure.
Another approach is to use the subplotpars kwarg to adjust the positioning parameters when initializing the figure.
Eric
Another approach is to use the subplotpars kwarg to adjust
the positioning parameters when initializing the figure.
Here's how I like to implement that approach when I want strict dimensions:
figW = 6.5 # in inches
figH = 7
fig = figure(figsize=(figW, figH),
subplotpars=mpl.figure.SubplotParams(
left= (48 / 72.0) / figW, # 48-point left margin
bottom= (36 / 72.0) / figH, # etc.
right= 1 - (18 / 72.0) / figW,
top= 1 - (12 / 72.0) / figH))