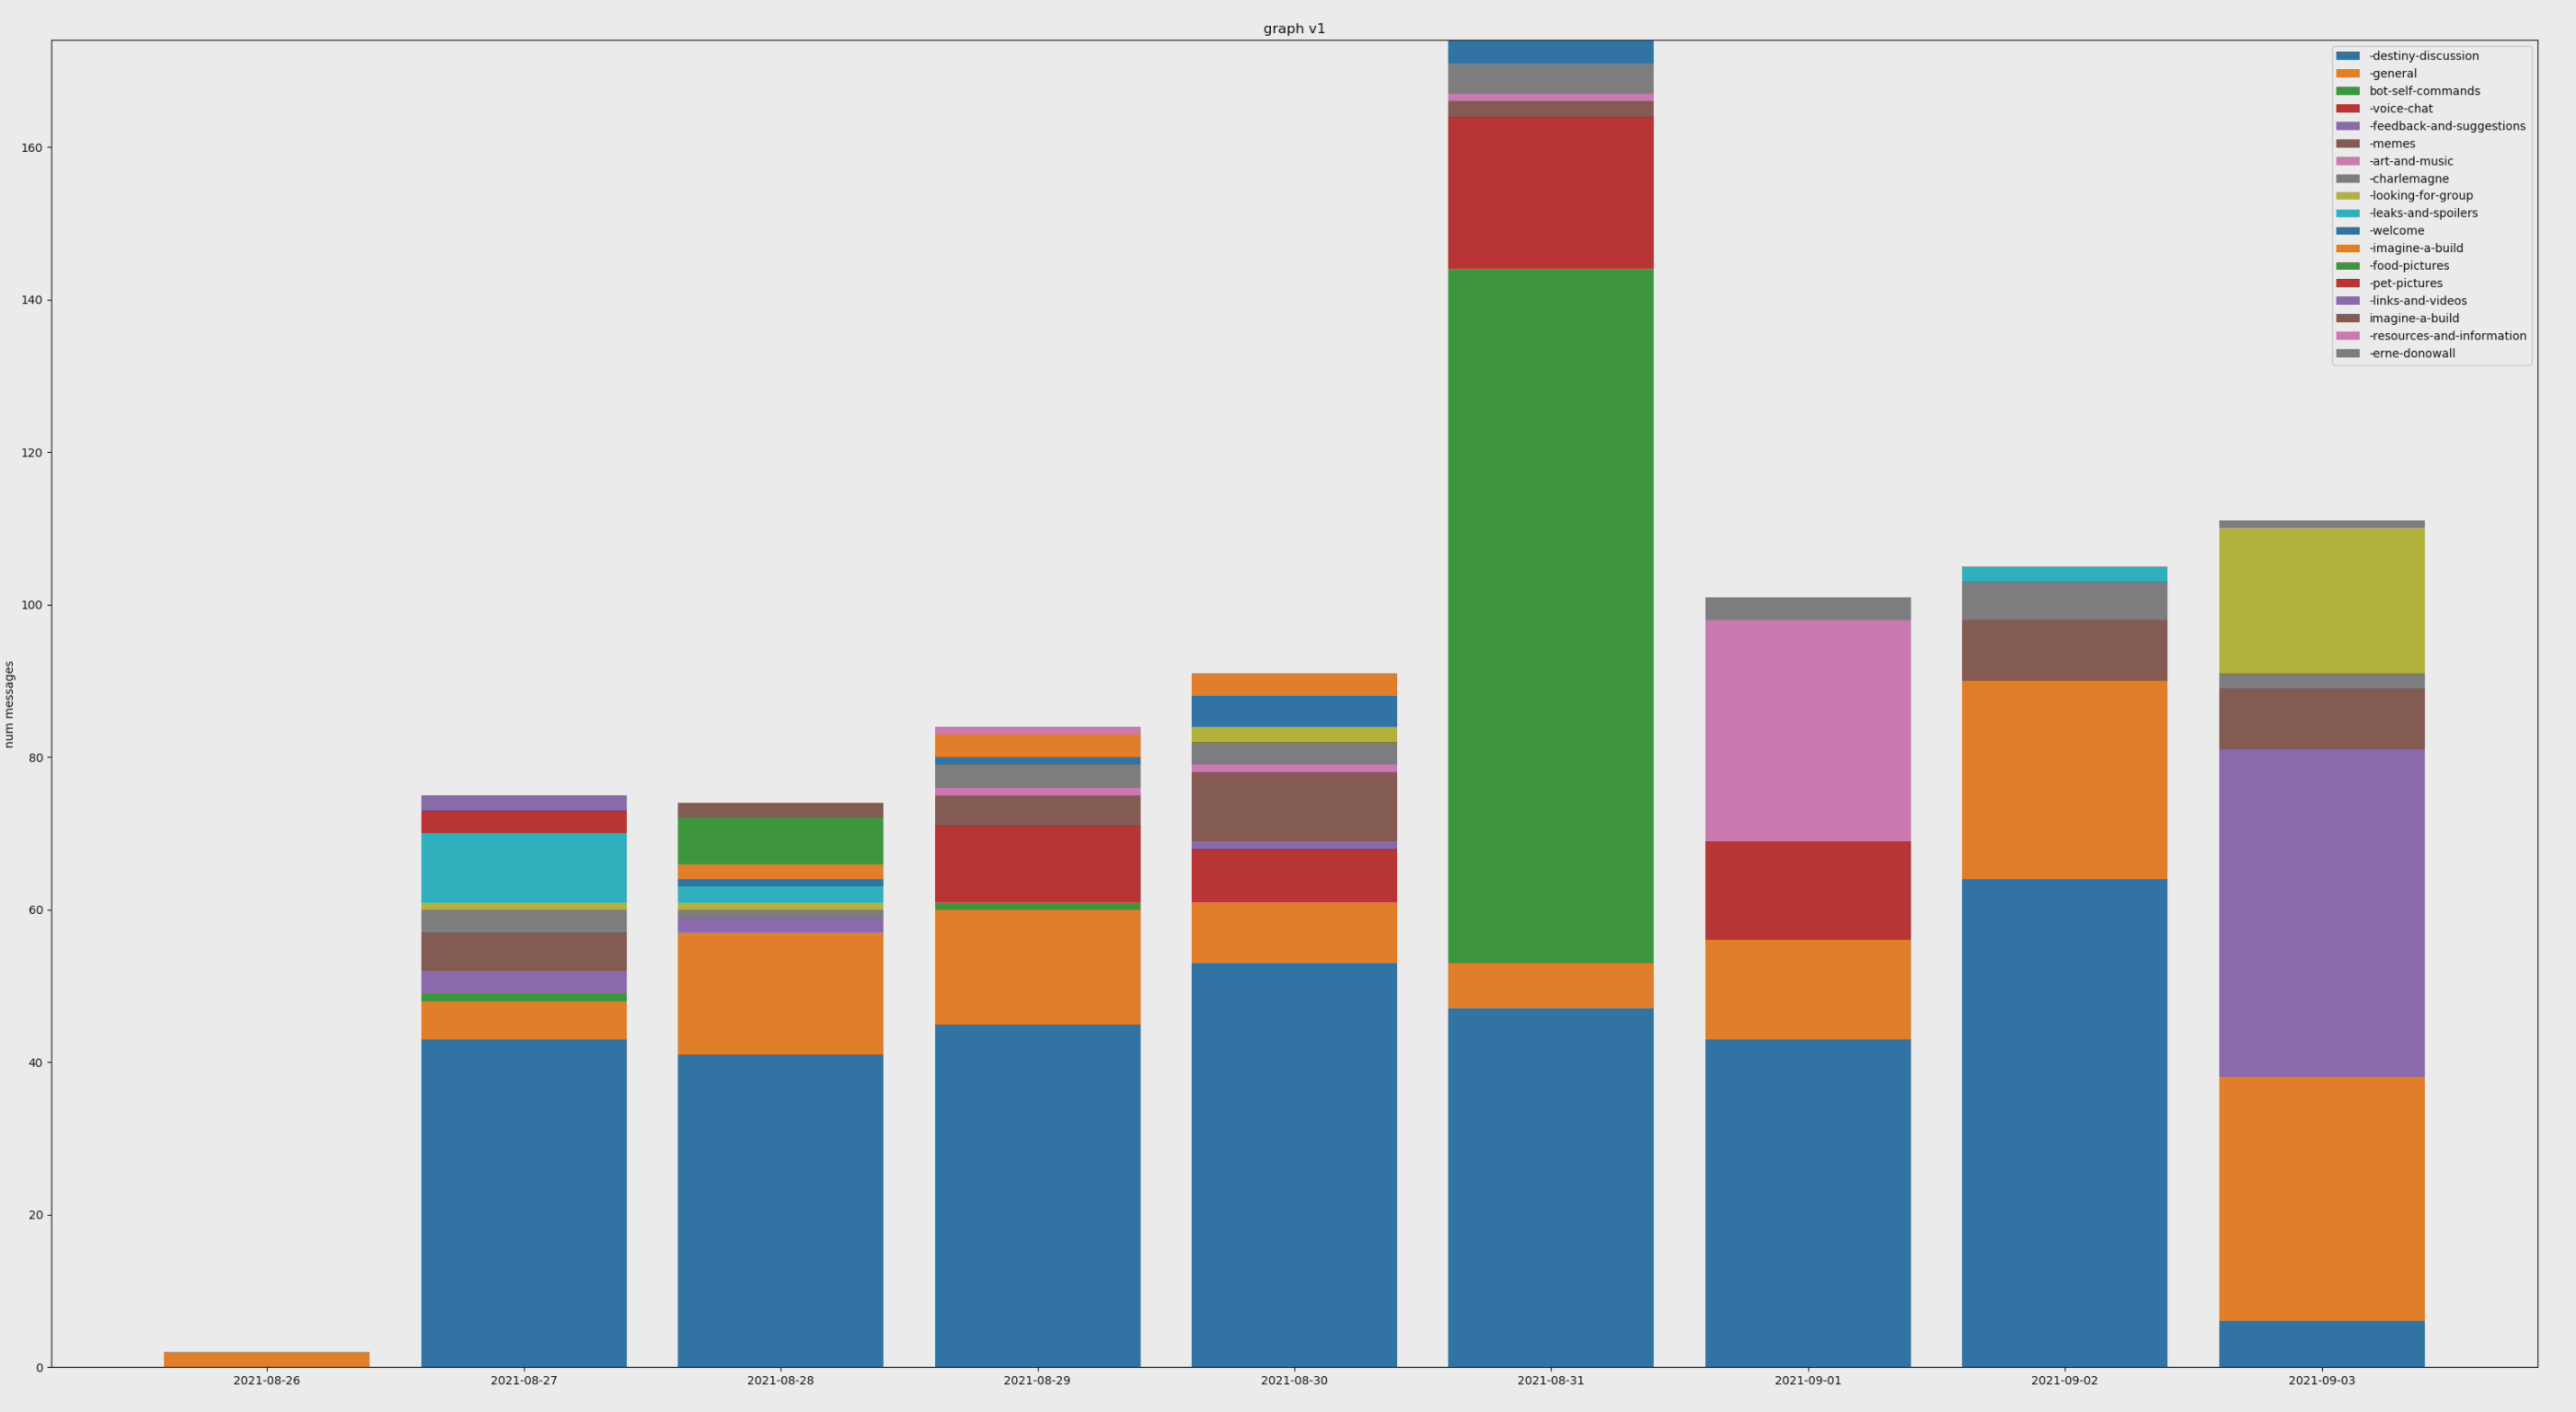
Im failing hard trying to label my stacked bar chart. at first i was trying to use the mouse to hover over a bar in the chart to display its name and value since i have so many stacked bars the legend repeats itself with its colors(im not yet ready to try to dynamically make my own list of colors). but i could not get mplcursors to install for my ras pi for python3. so i moved to trying to just statically lebel every stacked bar with its name and value but cannot seem to find usable demos or code snippets to help me construct that kind of thing. i know i make my graph in a weird way but thats because its using a file created by a discord bot to track and then graph discord channel activities. i can put my code in a comment if need be since its pretty long to generate the bars.