Hello,
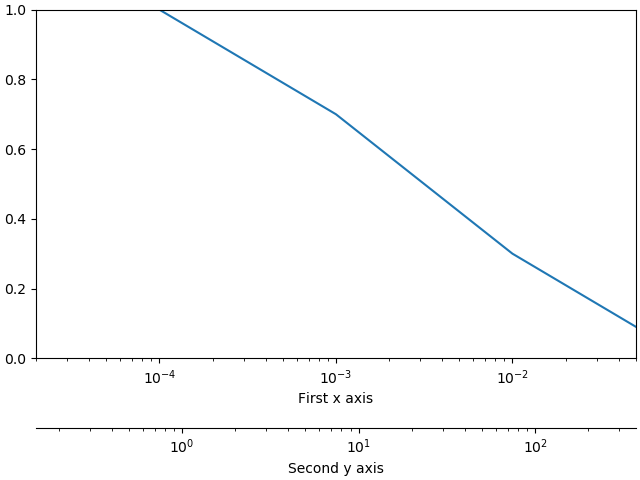
I would like to be able to format a secondary axis different to the first x axis. This is a minimal example of what I have now:
However, it is not as clear as I want it to be. Since the secondary axis represent a length, I would like it to be in scalar notation (1, 10, 100) instead of the logarithm notation. (The first axis could be either, but the 10^x notation is probably clearer there).
I know how do to it for a singular axis, but it seems that the SecondaryAxis class rewrite the ticks if I set them. How can I do it/make sure that my edit are taken into account ?
This is the minimal code to reproduce the example:
import matplotlib.pyplot as plt
fig, ax1 = plt.subplots(1, 1, constrained_layout=True)
ax1.semilogx([1e-4, 1e-3, 1e-2, 1e-1], [1, 0.7, 0.3, 0.0])
ax1.set_xlabel("First x axis")
ax1.set_xlim([2e-5, 0.05])
ax1.set_ylim([0,1.0])

def func(T):
    return T*1000*3.72*2

def invfunc(d):
    return d/(1000*3.72*2)

secax = ax1.secondary_xaxis(-0.2, functions=(func,invfunc))
secax.set_xlabel("Second x axis")
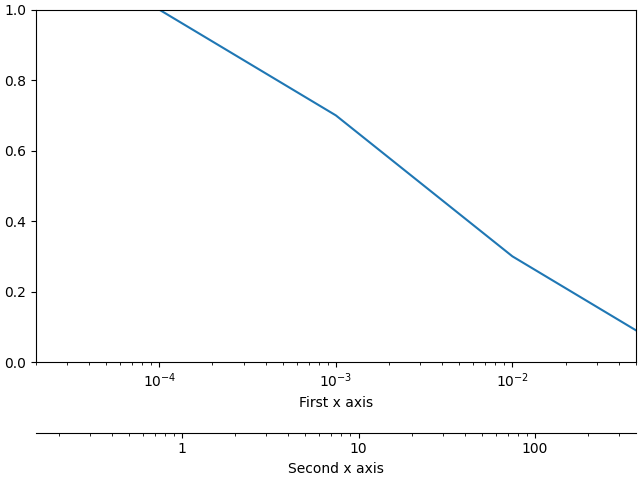
Thank you for providing a clean example 
The secondary Axes has the same API as a normal Axes, so to change the tick formatter we can do:
import matplotlib.pyplot as plt
fig, ax1 = plt.subplots(1, 1, constrained_layout=True)
ax1.semilogx([1e-4, 1e-3, 1e-2, 1e-1], [1, 0.7, 0.3, 0.0])
ax1.set_xlabel("First x axis")
ax1.set_xlim([2e-5, 0.05])
ax1.set_ylim([0,1.0])

def func(T):
    return T*1000*3.72*2

def invfunc(d):
    return d/(1000*3.72*2)

secax = ax1.secondary_xaxis(-0.2, functions=(func,invfunc))
secax.set_xlabel("Second x axis")

# ADDED CODE
from matplotlib.ticker import ScalarFormatter
secax.xaxis.set_major_formatter(ScalarFormatter())
# ADDED CODE
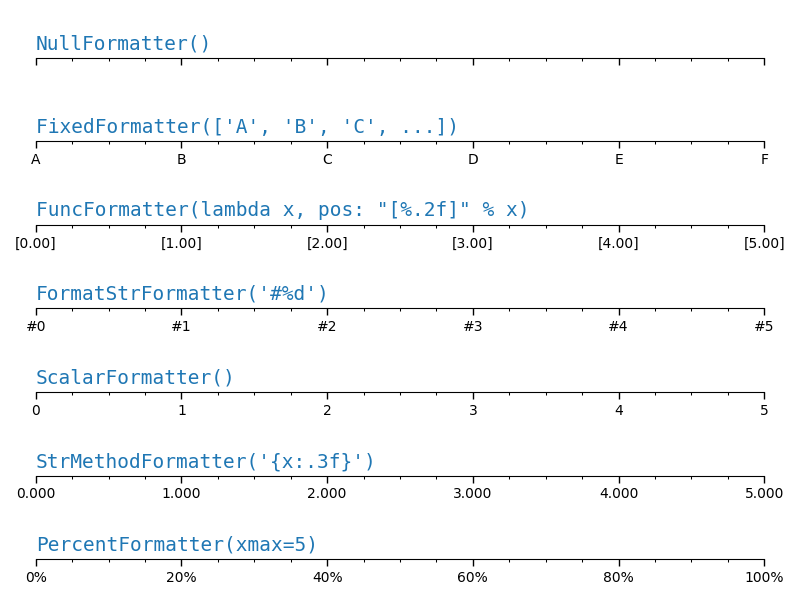
To see more of the formatters we provide, see Tick formatters — Matplotlib 3.2.2 documentation
Thank you for the reply.
Unfortunately, this is not working for me with the latest version available from pip (3.2.2). Your example returns the same figure as before.
Did this behavior got changed recently, or is it dependent on other settings ?
Can you be more specific about “not working”?
Ah, I managed to reproduce it, there seems to be some sort of race-condition about when the formatters get set (!) which is not present on the master branch. I think what is happening is that we set it to ScalerFormatter and then as part of the first draw Matplotlib internally re-sets it to the Log formatter. We can defeat this by forcing a draw:
import matplotlib.pyplot as plt
from matplotlib.ticker import ScalarFormatter

fig, ax1 = plt.subplots(1, 1, constrained_layout=True)
ax1.semilogx([1e-4, 1e-3, 1e-2, 1e-1], [1, 0.7, 0.3, 0.0])
ax1.set_xlabel("First x axis")
ax1.set_xlim([2e-5, 0.05])
ax1.set_ylim([0,1.0])

def func(T):
    return T*1000*3.72*2

def invfunc(d):
    return d/(1000*3.72*2)

secax = ax1.secondary_xaxis(-0.2, functions=(func,invfunc))
secax.set_xlabel("Second x axis")


# ADDED CODE
fig.canvas.draw()
# ADDED CODE


secax.xaxis.set_major_formatter(ScalarFormatter())

plt.show()
works for me an 3.2.2. That is a surprising bug…
We plan do to the final release of 3.3.0 this week, there is an rc on pypi if you are feeling adventourous (pip install ---upgrade --pre matplotlib) 
Thank you very much !
Your solution works for me too. I’ll try the rc, it’s probably going to be easier than inserting the workaround in the real script (with several subplots).