Hello,
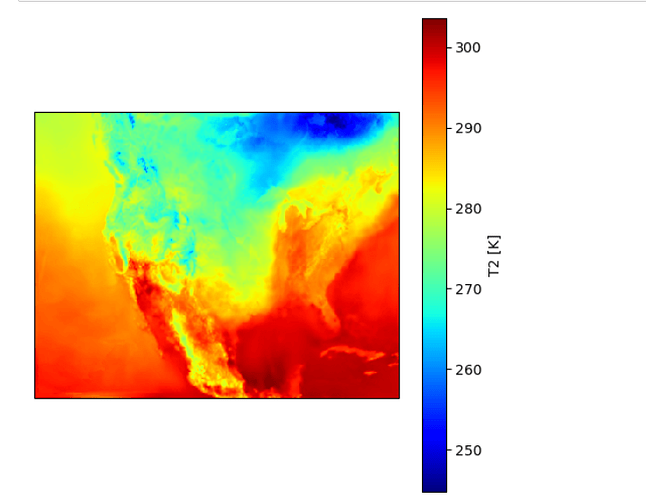
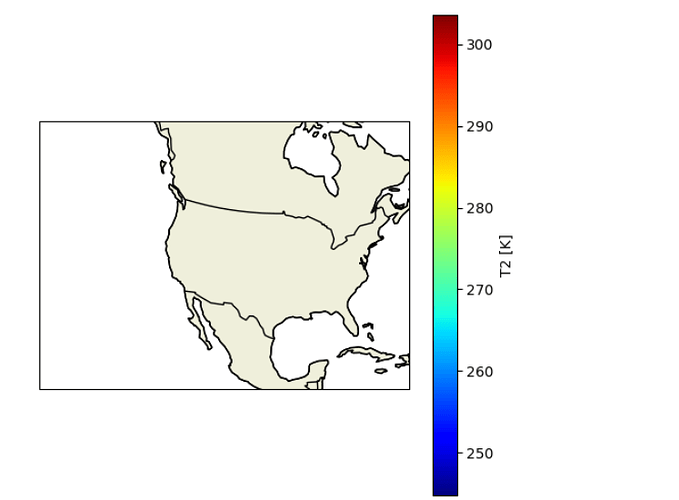
I recently started using python via jupyter on windows to plot netCDF data. However I am having issues plotting data I got from a WRF run that uses lambert projection. I cannot seem to get the coastlines to be overlayed and lined up with the data plot i.e. the coastlines overylay either does not show up at all or is slightly offset from the data. Below is the codes I have tried to use but which resulted in separate issues. Any assistance in resolving this errors would be appreciated.
#Code 1:
from netCDF4 import Dataset
import xarray as xr
import matplotlib.pyplot as plt
import cartopy.crs as ccrs
ds = xr.open_dataset(“datafolder\output.nc”)
temp2 = ds.T2[0,:,:]
temp2
fig=plt.figure(figsize=(5, 5))
ax2 = fig.add_subplot(1, 1, 1, projection=ccrs.LambertConformal())
temp2.plot(ax=ax2, cmap=‘jet’, transform=ccrs.LambertConformal())
ax1.add_feature(cfeature.BORDERS, edgecolor=‘black’)
ax1.add_feature(cfeature.COASTLINE, edgecolor=‘black’)
plt.show()
#-------------------------------------------------------------------------#
#Code 2:
from netCDF4 import Dataset
import xarray as xr
import matplotlib.pyplot as plt
import cartopy.crs as ccrs
ds = xr.open_dataset(r"datafolder\output.nc")
temp2 = ds.T2[0,:,:]
temp2
fig=plt.figure(figsize=(5, 5))
ax1 = fig.add_subplot(1, 1, 1, extent=(-140, -73, 14, 60), projection=ccrs.LambertConformal())
temp2.plot(ax=ax1, cmap=‘jet’, transform=ccrs.LambertConformal())
ax1.add_feature(cfeature.BORDERS, edgecolor=‘black’)
ax1.add_feature(cfeature.COASTLINE, edgecolor=‘black’)
plt.show()
#----------------------------------------------------------------#
Attached are the output of code 1 and code 2 respectively

