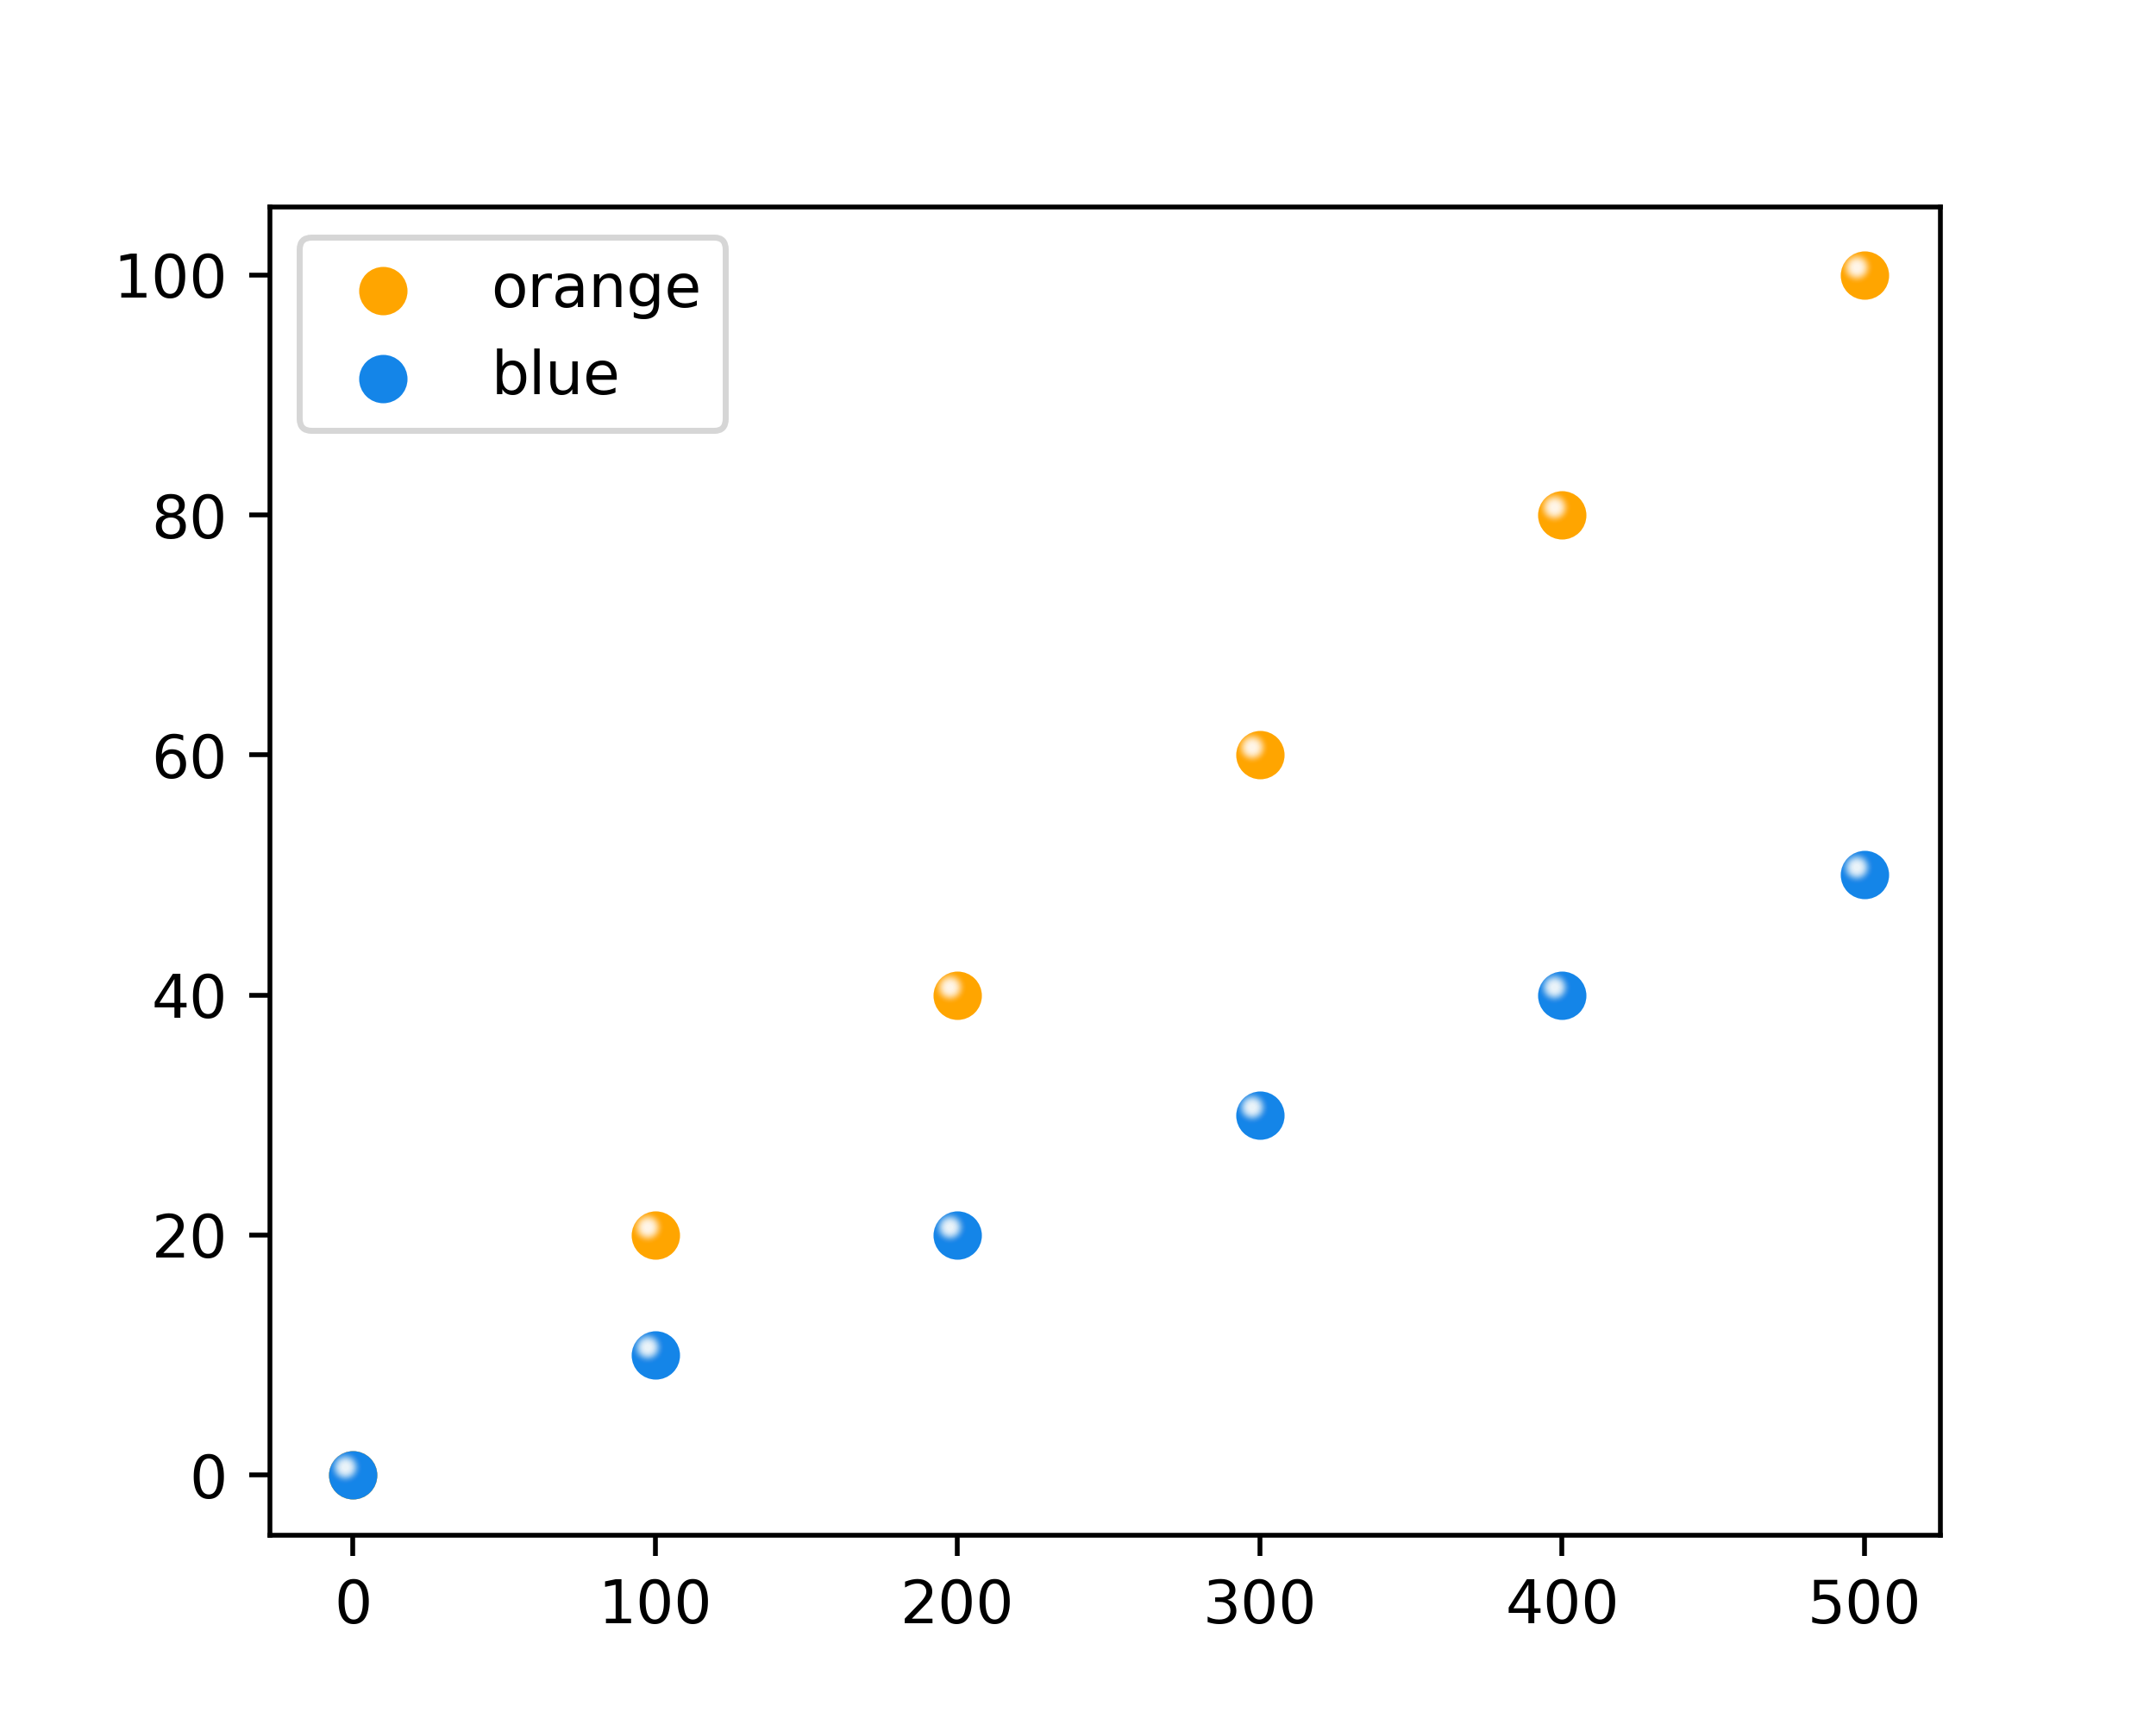
Hi, is there a way to draw such a scatter plot?
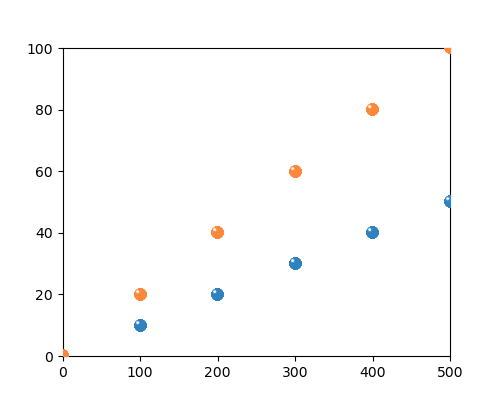
I got this plot through these codes, but with some problems.
Firstly, the excess part needs to be erased by Photoshop.
Secondly, there is no legend.
So is there any other way to get this kind of scatter plot with sphere marker style? Create a custom maker?
import numpy as np
import math
import matplotlib.pyplot as plt
from matplotlib.offsetbox import OffsetImage, AnnotationBbox
from matplotlib.cbook import get_sample_data
def getImage(path):
    return OffsetImage(plt.imread(path), zoom=0.03)

fig = plt.figure(figsize=[5,4],dpi=300)
ax1 = fig.add_subplot(1,1,1)

X=[0,100,200,300,400,500]
Y1=[i*0.1 for i in X ]
Y2=[i*0.2 for i in X ]
paths1 = ['a.png']*len(X)
paths2 = ['b.png']*len(X)
for x0, y0, path in zip(X,Y1,paths1):
    ab = AnnotationBbox(getImage(path), (x0, y0), frameon=False)
    ax1.add_artist(ab)
for x0, y0, path in zip(X,Y2,paths2):
    ab = AnnotationBbox(getImage(path), (x0, y0), frameon=False)
    ax1.add_artist(ab)
plt.xlim([0,500])
plt.ylim([0,100])
plt.savefig('scatter_sphere_marker.png')
I am a new user, without permission to upload a.png and b.png. They are orange and blue shiny balls.