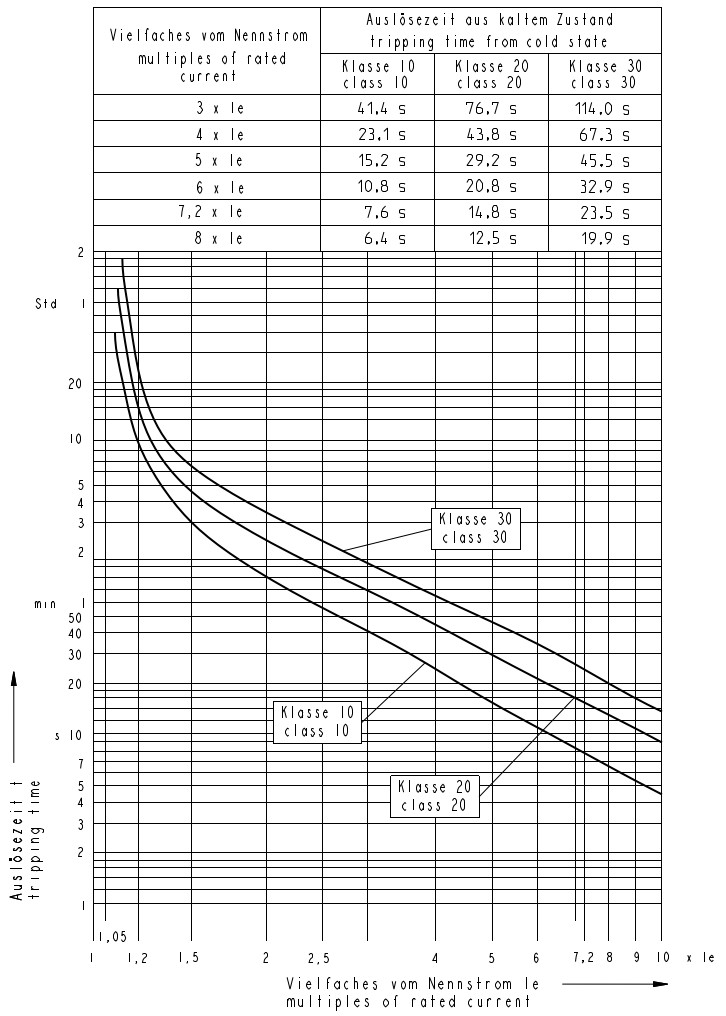
Sure, see for example the loglog scaling here: https://matplotlib.org/stable/users/explain/axes/axes_scales.html