Hello,
I need to interpolate from a 2d grid to another one.
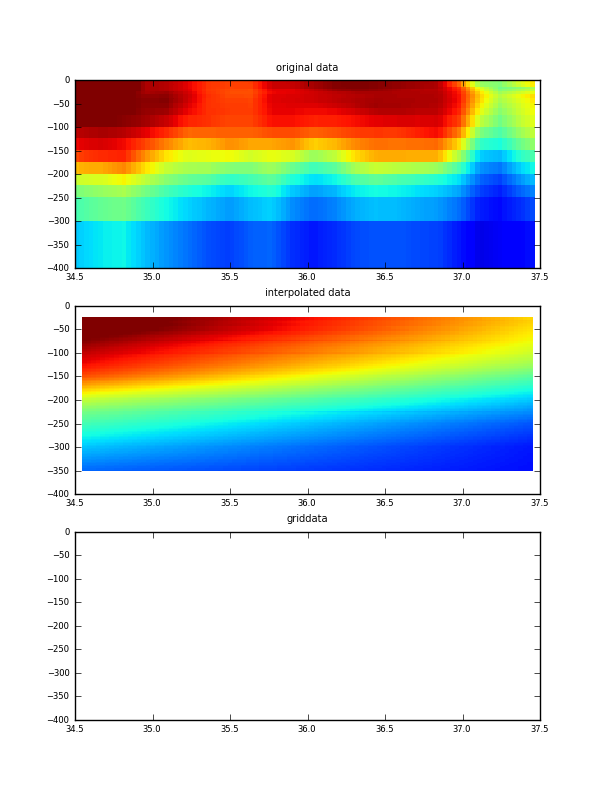
I tryed to use griddata (with natgrid) but the returned data if fully masked. So, I used directly delaunay triangulation and I obtained quite bad results!!
I send attached a small code and the output figure as png. I also send my data as npz (32k).
To generate it just run
>>python test.py 1
or from python:
>import test
>test.go()
Thanks for the help
mma
matplotlib.__version__
0.99.1
uname -a
Linux cxx 2.6.25.20-0.7-default #1 SMP 2010-02-26 20:32:57 +0100 x86_64 x86_64 x86_64 GNU/Linux
test.py (1.14 KB)
data.npz (31.8 KB)
The griddata function should be doing delaunay triangulation by default, so the result from griddata should be identical to the second plot. I see that you are using a “mask” for x0, y0, v0. This is unnescessary, as you really want to pass the “flat” arrays.
I can not get a masked array from griddata. Actually, I have to pass in flat arrays to make it work at all. And the result is identical to the second plot:
ui = pylab.mlab.griddata(x0.flat, y0.flat, v0.flat, xi, yi)
As to whether the result is “correct” or not, I am not qualified to say, so I will leave that to someone else to determine.
Ben Root
···
On Sun, Jun 27, 2010 at 8:28 PM, Martinho MA <mma@…3177…> wrote:
Hello,
I need to interpolate from a 2d grid to another one.
I tryed to use griddata (with natgrid) but the returned data if fully masked. So, I used directly delaunay triangulation and I obtained quite bad results!!
I send attached a small code and the output figure as png. I also send my data as npz (32k).
To generate it just run
python test.py 1
or from python:
import test
test.go()
Thanks for the help
mma
matplotlib.version
0.99.1
uname -a
Linux cxx 2.6.25.20-0.7-default #1 SMP 2010-02-26 20:32:57 +0100 x86_64 x86_64 x86_64 GNU/Linux
This SF.net email is sponsored by Sprint
What will you do first with EVO, the first 4G phone?
Visit sprint.com/first – http://p.sf.net/sfu/sprint-com-first
Matplotlib-users mailing list
[email protected]
https://lists.sourceforge.net/lists/listinfo/matplotlib-users
hummm
ok, I was thinking griddata could accept 2d input ... anyway, to use mask or flat arrays is the same. I use a mask because in some cases I will find masked values I shall not use in the interpolation.
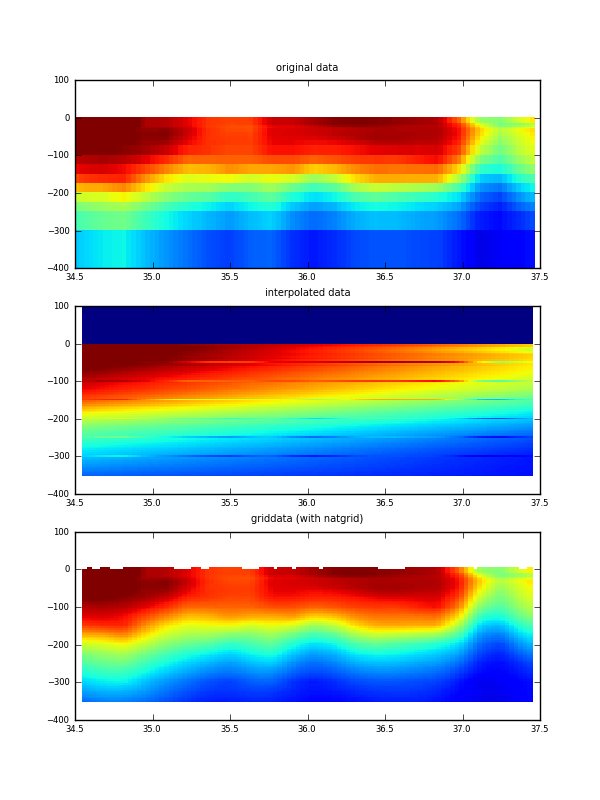
Yes, griddata uses delaunay be default, but if the natgrid toolkit is installed, griddata will use it instead. And that is my case.
So, now, griddata+natgrid is giving me nice results, But I am really interested in delaunay for speed reasons. With delaunay I can create the tri object and apply it to any number of variables.
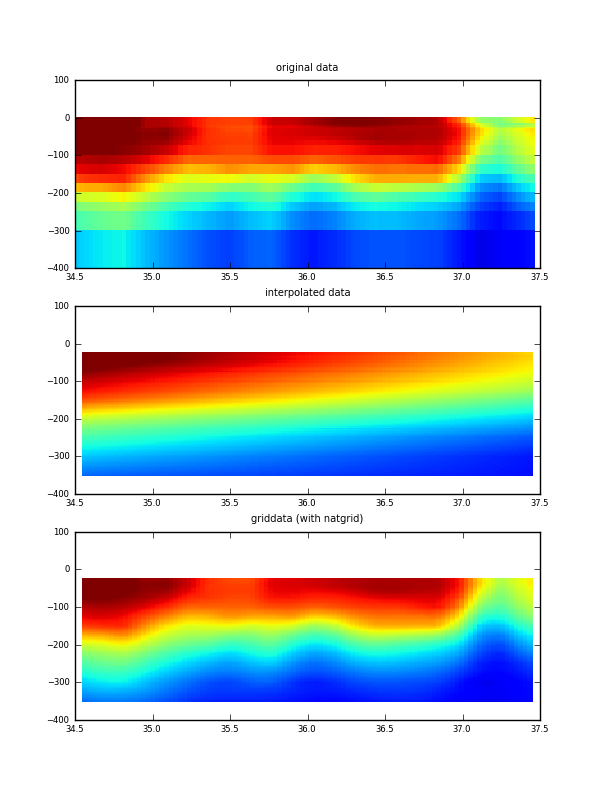
However I still think there is some problem with delaunay. I created another test where I simply change my target yi, adding data outside the limits. I was expecting the data inside the original data limits would not differ. But it was not the case. Actually I obtain very bad results, with great unreal discontinuities
I send the tow cases attached
thanks you
mma
Benjamin Root wrote:
test.py (1.31 KB)
···
The griddata function should be doing delaunay triangulation by default, so the result from griddata should be identical to the second plot. I see that you are using a "mask" for x0, y0, v0. This is unnescessary, as you really want to pass the "flat" arrays.
I can not get a masked array from griddata. Actually, I have to pass in flat arrays to make it work at all. And the result is identical to the second plot:
ui = pylab.mlab.griddata(x0.flat, y0.flat, v0.flat, xi, yi)
As to whether the result is "correct" or not, I am not qualified to say, so I will leave that to someone else to determine.
Ben Root
On Sun, Jun 27, 2010 at 8:28 PM, Martinho MA <[email protected]... > <mailto:mma@…1770…>> wrote:
Hello,
I need to interpolate from a 2d grid to another one.
I tryed to use griddata (with natgrid) but the returned data if
fully masked. So, I used directly delaunay triangulation and I
obtained quite bad results!!
I send attached a small code and the output figure as png. I also
send my data as npz (32k).
To generate it just run
>>python test.py 1
or from python:
>import test
>test.go()
Thanks for the help
mma
matplotlib.__version__
0.99.1
uname -a
Linux cxx 2.6.25.20-0.7-default #1 SMP 2010-02-26 20:32:57 +0100
x86_64 x86_64 x86_64 GNU/Linux
------------------------------------------------------------------------------
This SF.net email is sponsored by Sprint
What will you do first with EVO, the first 4G phone?
Visit sprint.com/first <http://sprint.com/first> --
http://p.sf.net/sfu/sprint-com-first
_______________________________________________
Matplotlib-users mailing list
[email protected]
<mailto:[email protected]>
matplotlib-users List Signup and Options