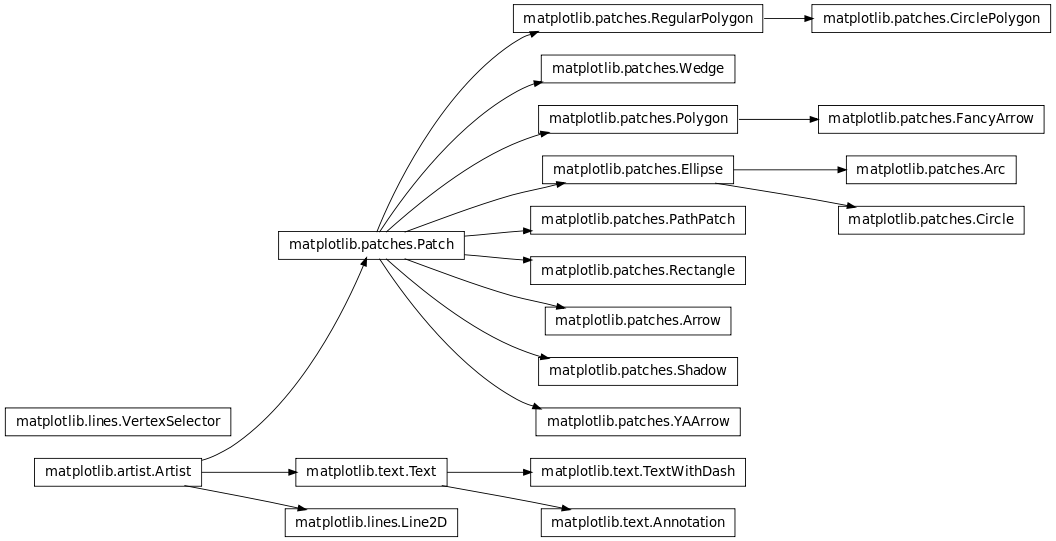
I just committed support for inheritance graphs in the docs like the one attached. In the docs themselves, an image map is included so clicking on a node hyperlinks to the class docs.
It uses "dot" to render the graph, and therefore you must have graphviz installed. If it isn't, the directive *should* insert warnings in the docs and not hard fail, but please let me know if it does. We can just as easily change that behavior so it doesn't even insert the warnings.
I'm also interested in feedback on the usefulness of these graphs or ways they could be improved. I personally find them quite helpful, as long as they aren't too large. Rather than producing one graph for everything, it works pretty well to create graphs on the level of the current division of the API docs (artists, collections, transforms etc.)
This directive suffers from the same shortcoming as mathpng.py -- the images are written to _static which probably isn't a good place for generated files. Once we have a solution to this, I'll fix it. It may be worth collaborating with Georg Brandl et al. on a general solution for generated images. That will also make this directive more valuable as a general-purpose (non-matplotlib) directive.
Cheers,
Mike
···
--
Michael Droettboom
Science Software Branch
Operations and Engineering Division
Space Telescope Science Institute
Operated by AURA for NASA
Epydoc has support for this if you have dot/graphviz installed, but
I'm MUCH happier with the sphinx output. It would be really great if
you could bring all the remaining API-documentation features of epydoc
into sphinx, so we could finally have one tool to do it all.
Cheers,
f
···
On Thu, Jun 19, 2008 at 1:05 PM, Michael Droettboom <[email protected]...> wrote:
This directive suffers from the same shortcoming as mathpng.py -- the images
are written to _static which probably isn't a good place for generated
files. Once we have a solution to this, I'll fix it. It may be worth
collaborating with Georg Brandl et al. on a general solution for generated
images. That will also make this directive more valuable as a
general-purpose (non-matplotlib) directive.
I just committed support for inheritance graphs in the docs like the one
attached. In the docs themselves, an image map is included so clicking
on a node hyperlinks to the class docs.
Really cool, Mike.
It uses "dot" to render the graph, and therefore you must have graphviz
installed. If it isn't, the directive *should* insert warnings in the
docs and not hard fail, but please let me know if it does. We can just
as easily change that behavior so it doesn't even insert the warnings.
I'm also interested in feedback on the usefulness of these graphs or
ways they could be improved. I personally find them quite helpful, as
long as they aren't too large. Rather than producing one graph for
everything, it works pretty well to create graphs on the level of the
current division of the API docs (artists, collections, transforms etc.)
I agree, it works well with some boundary conditions. In the old users guide,
the inheritance diagram for backend FigureCanvases could have a big
rubberstamp across it that reads "COMPLICATED". (No offense intended, but
damn.  )
)
Darren
···
On Thursday 19 June 2008 04:05:26 pm Michael Droettboom wrote:
I think these will be really useful. I hope we can tweak the layout
somewhat -- I think some of these graphs are too wide, for example (eg
the artist graph). Of course, the rendering is also somewhat painful
to me, after years of looking at agg rendering. Maybe I need to write
a dot output renderer....
But aside from these minor stylistic nits which we can improve, the
functionality is great and I suspect sphinx will be interested in
including this.... Gee, we sure are acting like typical developers:
spending all our time working on the doc *system* rather than the
boring old docs themselves
JDH
···
On Thu, Jun 19, 2008 at 3:05 PM, Michael Droettboom <[email protected]...> wrote:
I just committed support for inheritance graphs in the docs like the one
attached. In the docs themselves, an image map is included so clicking on a
node hyperlinks to the class docs.
It uses "dot" to render the graph, and therefore you must have graphviz
installed. If it isn't, the directive *should* insert warnings in the docs
and not hard fail, but please let me know if it does. We can just as easily
change that behavior so it doesn't even insert the warnings.
John Hunter wrote:
I just committed support for inheritance graphs in the docs like the one
attached. In the docs themselves, an image map is included so clicking on a
node hyperlinks to the class docs.
It uses "dot" to render the graph, and therefore you must have graphviz
installed. If it isn't, the directive *should* insert warnings in the docs
and not hard fail, but please let me know if it does. We can just as easily
change that behavior so it doesn't even insert the warnings.
I think these will be really useful. I hope we can tweak the layout
somewhat -- I think some of these graphs are too wide, for example (eg
the artist graph).
One cheap way to deal with the width might be to just use the class name, not "matplotlib.artist. ...". But in general, if you have four levels of nesting, you're guaranteed four columns with the dot algorithm (excepting manual tweaks).
Of course, the rendering is also somewhat painful
to me, after years of looking at agg rendering. Maybe I need to write
a dot output renderer....
But aside from these minor stylistic nits which we can improve, the
functionality is great and I suspect sphinx will be interested in
including this.... Gee, we sure are acting like typical developers:
spending all our time working on the doc *system* rather than the
boring old docs themselves
Yep... 
Mike
···
On Thu, Jun 19, 2008 at 3:05 PM, Michael Droettboom <[email protected]...> wrote:
Michael Droettboom wrote:
John Hunter wrote:
Of course, the rendering is also somewhat painful
to me, after years of looking at agg rendering. Maybe I need to write
a dot output renderer....
The current version of graphviz uses either cairo or gd (the default being cairo on most modern installations.)
Now that you've uploaded the docs, I see that the font you're getting isn't as nice as mine. I was setting "fontname" to "sans", which is supposed to get the default sans serif font on the system. It appears, from testing, one can provide a list of fonts to dot, so I'll change it to try good fonts first, with sans as the last resort fallback.
It still makes the error of not pixel-aligning the rectangles, which makes the edges look fuzzy. That should probably be fixed.
Cheers,
Mike
···
--
Michael Droettboom
Science Software Branch
Operations and Engineering Division
Space Telescope Science Institute
Operated by AURA for NASA
I'm building and uploading the docs in a nightly cron on a linux box
that Fernando maintains. Can you tell him what package(s) need to be
installed to insure cairo rendering so he can update the box? The
anti-aliasing on some of the arrows looks pretty poor -- eg the arrow
from matplotlib.text.Text -> matplotlib.text.Annotation at
http://matplotlib.sourceforge.net/doc/html/api/artist_api.html. Is it
better on your box? Also, the start and end of the arrow locations is
pretty unsatisfying. You would think they could hit the box edges...
Is there a way to inform dot/graphiz to not exceed a certain width?
If so, I think we should set it so the images are not wider than some
reasonable browser window for the html.
JDH
···
On Fri, Jun 20, 2008 at 8:13 AM, Michael Droettboom <[email protected]...> wrote:
The current version of graphviz uses either cairo or gd (the default being
cairo on most modern installations.)
Now that you've uploaded the docs, I see that the font you're getting isn't
as nice as mine. I was setting "fontname" to "sans", which is supposed to
get the default sans serif font on the system. It appears, from testing,
one can provide a list of fonts to dot, so I'll change it to try good fonts
first, with sans as the last resort fallback.
Hey, these things are proving useful already. I was looking at the
inheritance graph at
http://matplotlib.sourceforge.net/doc/html/api/collections_api.html
and noticed a redundant ScalarMappable inheritance in the
LineCollection. (fixed in svn)
···
On Fri, Jun 20, 2008 at 8:13 AM, Michael Droettboom <[email protected]...> wrote:
Now that you've uploaded the docs, I see that the font you're getting isn't
as nice as mine. I was setting "fontname" to "sans", which is supposed to
get the default sans serif font on the system. It appears, from testing,
one can provide a list of fonts to dot, so I'll change it to try good fonts
first, with sans as the last resort fallback.
John Hunter wrote:
The current version of graphviz uses either cairo or gd (the default being
cairo on most modern installations.)
Now that you've uploaded the docs, I see that the font you're getting isn't
as nice as mine. I was setting "fontname" to "sans", which is supposed to
get the default sans serif font on the system. It appears, from testing,
one can provide a list of fonts to dot, so I'll change it to try good fonts
first, with sans as the last resort fallback.
I'm building and uploading the docs in a nightly cron on a linux box
that Fernando maintains. Can you tell him what package(s) need to be
installed to insure cairo rendering so he can update the box?
My understanding is that gd doesn't support antialiasing at all, so if you're seeing antialiasing you're using Cairo. To be absolutely certain you're using Cairo, you can change the "-Tpng" to "-Tpng:cairo" (though I don't know if we should do that in general, since it will break for users who don't have Cairo, if such users exist...).
With my latest updates, you should ensure that there is a decent-looking font, such as Vera Sans, on the fontconfig path. You should also make sure that libpango is being used by your graphviz. It's optional in graphviz, but is used by the pre-built packages on Debian Etch and Ubuntu Hardy at least.
The
anti-aliasing on some of the arrows looks pretty poor -- eg the arrow
from matplotlib.text.Text -> matplotlib.text.Annotation at
http://matplotlib.sourceforge.net/doc/html/api/artist_api.html. Is it
better on your box?
No. Not any better.
Also, the start and end of the arrow locations is
pretty unsatisfying. You would think they could hit the box edges...
Yes. That is surprising. Even for arrows that are straight and axis aligned it doesn't seem to always work. PDF output isn't any better, suggesting it's not just a low-level rendering issue.
Is there a way to inform dot/graphiz to not exceed a certain width?
If so, I think we should set it so the images are not wider than some
reasonable browser window for the html.
Yes. You can change the "size" graph option which is given in inches (with a default dpi for png of 96). I've set this to 8, which should work for resolutions of 1024x768, accounting for the left margin of the webpage. Note that if the size exceeds this, the layout doesn't change, it is just scaled down.
Cheers,
Mike
···
On Fri, Jun 20, 2008 at 8:13 AM, Michael Droettboom <[email protected]...> wrote:
--
Michael Droettboom
Science Software Branch
Operations and Engineering Division
Space Telescope Science Institute
Operated by AURA for NASA
Michael Droettboom wrote:
John Hunter wrote:
Also, the start and end of the arrow locations is
pretty unsatisfying. You would think they could hit the box edges...
Yes. That is surprising. Even for arrows that are straight and axis aligned it doesn't seem to always work. PDF output isn't any better, suggesting it's not just a low-level rendering issue.
Google found me dot2tex:
http://www.fauskes.net/code/dot2tex/documentation/
which seems to produce much nicer arrow head alignment, since it uses PGF/TikZ for that. I don't think it's a viable alternative, however, given the number of moving parts.
If you're a graph layout geek, though, you might appreciate some of the examples in the docs.
Cheers,
Mike
···
On Fri, Jun 20, 2008 at 8:13 AM, Michael Droettboom <[email protected]...> wrote:
--
Michael Droettboom
Science Software Branch
Operations and Engineering Division
Space Telescope Science Institute
Operated by AURA for NASA
Hey Michael,
John Hunter wrote:
The current version of graphviz uses either cairo or gd (the default being
cairo on most modern installations.)
Now that you've uploaded the docs, I see that the font you're getting isn't
as nice as mine. I was setting "fontname" to "sans", which is supposed to
get the default sans serif font on the system. It appears, from testing,
one can provide a list of fonts to dot, so I'll change it to try good fonts
first, with sans as the last resort fallback.
I'm building and uploading the docs in a nightly cron on a linux box
that Fernando maintains. Can you tell him what package(s) need to be
installed to insure cairo rendering so he can update the box?
My understanding is that gd doesn't support antialiasing at all, so if
you're seeing antialiasing you're using Cairo. To be absolutely certain
you're using Cairo, you can change the "-Tpng" to "-Tpng:cairo" (though
I don't know if we should do that in general, since it will break for
users who don't have Cairo, if such users exist...).
With my latest updates, you should ensure that there is a decent-looking
font, such as Vera Sans, on the fontconfig path. You should also make
sure that libpango is being used by your graphviz. It's optional in
graphviz, but is used by the pre-built packages on Debian Etch and
Ubuntu Hardy at least.
Unfortunately this is a Fedora 8 box that was given to me. I do have
sudo access, so I can install whatever we want, but it's not ubuntu.
I may update it to Ubuntu later (that's what I use on all my regular
machines) but right now I'm too busy for that.
Do you have any clue as to what packages might do the trick for
Fedora? I'm happy to add anything, I just don't know what to look
for...
Cheers,
f
···
On Fri, Jun 20, 2008 at 7:47 AM, Michael Droettboom <[email protected]...> wrote:
On Fri, Jun 20, 2008 at 8:13 AM, Michael Droettboom <[email protected]...> wrote:
Fernando Perez wrote:
Hey Michael,
John Hunter wrote:
The current version of graphviz uses either cairo or gd (the default being
cairo on most modern installations.)
Now that you've uploaded the docs, I see that the font you're getting isn't
as nice as mine. I was setting "fontname" to "sans", which is supposed to
get the default sans serif font on the system. It appears, from testing,
one can provide a list of fonts to dot, so I'll change it to try good fonts
first, with sans as the last resort fallback.
I'm building and uploading the docs in a nightly cron on a linux box
that Fernando maintains. Can you tell him what package(s) need to be
installed to insure cairo rendering so he can update the box?
My understanding is that gd doesn't support antialiasing at all, so if
you're seeing antialiasing you're using Cairo. To be absolutely certain
you're using Cairo, you can change the "-Tpng" to "-Tpng:cairo" (though
I don't know if we should do that in general, since it will break for
users who don't have Cairo, if such users exist...).
With my latest updates, you should ensure that there is a decent-looking
font, such as Vera Sans, on the fontconfig path. You should also make
sure that libpango is being used by your graphviz. It's optional in
graphviz, but is used by the pre-built packages on Debian Etch and
Ubuntu Hardy at least.
Unfortunately this is a Fedora 8 box that was given to me. I do have
sudo access, so I can install whatever we want, but it's not ubuntu.
I may update it to Ubuntu later (that's what I use on all my regular
machines) but right now I'm too busy for that.
I didn't mean to imply that Debian/Ubuntu was required, those are just the ones that I looked at as a sampling. It looks like Fedora 8 also links graphviz with libpango, according to its rpm spec.
Do you have any clue as to what packages might do the trick for
Fedora? I'm happy to add anything, I just don't know what to look
for...
It looks like you're already good to go, judging by what's now up on matplotlib.sf.net. My change this morning to use "Vera Sans", if available, rather than "sans" (which maps to the default sans-serif font on the system), seems to have done the trick.
The issues John pointed out -- the fuzzy rectangles, bad arrowhead alignment -- seem to just be what graphviz does. We're not going to get any better without being clever.
Cheers,
Mike
···
On Fri, Jun 20, 2008 at 7:47 AM, Michael Droettboom <[email protected]...> wrote:
On Fri, Jun 20, 2008 at 8:13 AM, Michael Droettboom <[email protected]...> wrote:
--
Michael Droettboom
Science Software Branch
Operations and Engineering Division
Space Telescope Science Institute
Operated by AURA for NASA
I didn't mean to imply that Debian/Ubuntu was required, those are just the
ones that I looked at as a sampling. It looks like Fedora 8 also links
graphviz with libpango, according to its rpm spec.
Oh, no worries: I'm also much more familiar with the ubuntu packages,
so I was just mentioning it because I'm a bit lost with the recent
Fedora package structure. I hadn't used Fedora in years until I got
this box recently.
Do you have any clue as to what packages might do the trick for
Fedora? I'm happy to add anything, I just don't know what to look
for...
It looks like you're already good to go, judging by what's now up on
matplotlib.sf.net. My change this morning to use "Vera Sans", if available,
rather than "sans" (which maps to the default sans-serif font on the
system), seems to have done the trick.
The issues John pointed out -- the fuzzy rectangles, bad arrowhead alignment
-- seem to just be what graphviz does. We're not going to get any better
without being clever.
OK, just let me know if anything is needed, and good luck with the release!
Cheers,
f
···
On Fri, Jun 20, 2008 at 11:18 AM, Michael Droettboom <[email protected]...> wrote: